")
This work was originally published by NOAA National Centers for Environmental Information and altered slightly for ESSIC.
New tool shows the distribution of seven ocean acidification indicators in North American coastal waters
Since the industrial revolution began a little over 200 years ago, the concentration of carbon dioxide (CO2) in the atmosphere has increased by about 50% due to the burning of fossil fuels, cement production, and land use change. The ocean acts as a “carbon sink” and absorbs between 20% and 30% of the CO2 emissions released into the atmosphere. When CO2 is absorbed by seawater, the chemistry of the ocean is changed. This phenomenon is commonly referred to as ocean acidification (OA).
Ocean acidification is a global threat to the world’s oceans, estuaries, and waterways. OA can harm sea life, particularly commercially valuable species. It is best known for its osteoporosis-like effects on shellfish, which makes building and maintaining shells difficult for oysters, clams, sea urchins, shallow water corals, and deep sea corals. Ocean acidification is expected to have negative overall effects on many marine species which could alter marine food web, change the community composition and structure, and food supply to humans.
The growing concern about acidity has led to an increase in research, monitoring, and the development of management measures. Long-term monitoring and scientific analysis of ocean carbon data are critical to anticipate, mitigate, and adapt to potential future changes. Effective stewardship of important OA data is also essential. A new set of OA climatologies has been developed that provides valuable OA information for the coastal ocean where 90% of fisheries yields are located.
Coastal Ocean Acidification Indicators
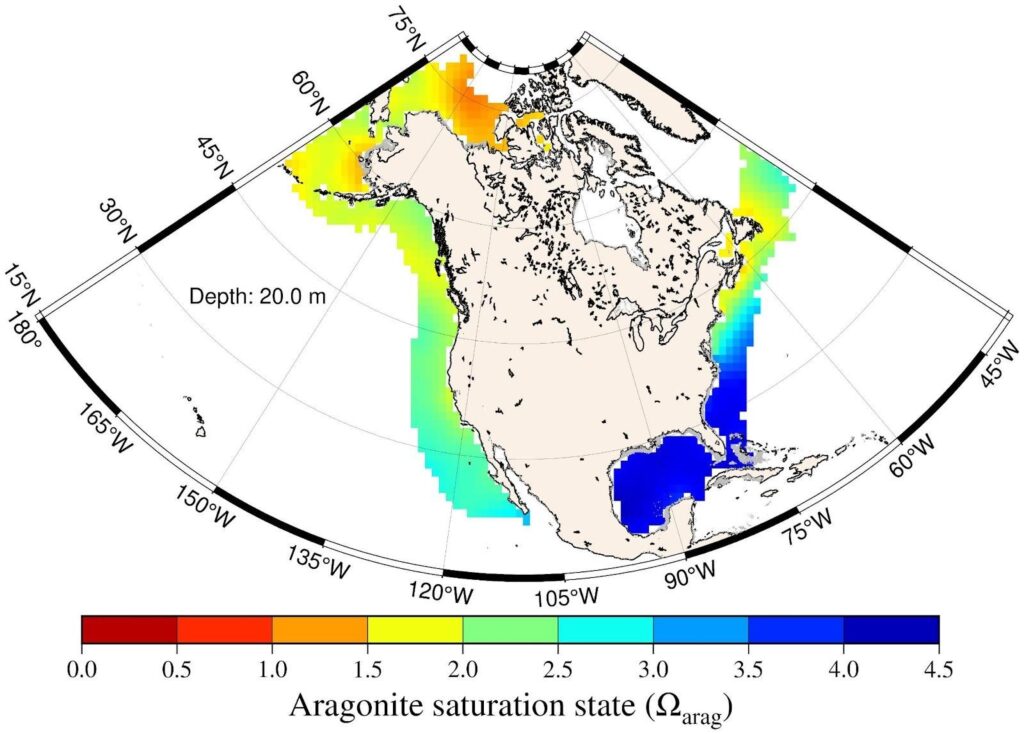
ESSIC Scientist Li-Qing Jiang is principal investigator on the new North American Coastal Ocean Acidification Indicators Climatologies, based on the recently released Coastal Ocean Data Analysis Product for North America (CODAP-NA), along with the Global Ocean Data Analysis Product version 2 (GLODAPv2). Utilizing the World Ocean Atlas gridding techniques, the North American Coastal Ocean Acidification Indicators Climagologies contains 1×1 degree gridded fields (mean fields of oceanographic variables on a regular geographic grid at specific depths) from surface to 500 meters water depth on North American ocean margins. The climatologies show the distribution of seven ocean acidification indicators: aragonite saturation state, calcite saturation state, carbonate ion content, total dissolved inorganic carbon content, total hydrogen ion content, free hydrogen ion content, pH total scale, and total alkalinity. The climatologies can be downloaded as NetCDF files, one for each variable.
“This is the first time the ocean acidification conditions in U.S. coastal waters are being reported,” said Jiang, “The developed climatologies and atlases will serve as a baseline for future changes.”
In addition to the data packages, there is a companion visualization tool: Atlas of North American Coastal Ocean Acidification Indicators. Users can select the indicator and depth to provide a visualization of the data.
NCEI provides access to the North American Coastal Ocean Acidification Indicators through the NCEI Ocean Carbon Data System (OCADS). The OCADS collection is an ocean carbon data repository created to support regional to global ocean carbon cycling and ocean acidification research. The OCADS project is funded by the NOAA Ocean Acidification Program (OAP), the Global Ocean Monitoring and Observing Program (GOMO), and NCEI.
NCEI plays a critical role in each of NOAA’s strategic goals by maintaining the most comprehensive public archive of environmental data in the United States and equitably distributing scientific products that drive decision-making across sectors, supporting the new blue economy and climate-informed strategies.