The Beaufort Gyre Exploration Project
By: Alek Petty
Introduction:
The Beaufort Gyre Exploration Project, launched back in 2003 and currently supported by the National Science Foundation, strives to increase our understanding of freshwater changes within the Beaufort Sea.
The main activity of the project is an annual research expedition taking place in summer (around the time of the Arctic sea ice minimum) on-board a Canadian icebreaker. The expedition provides scientists with the opportunity to deploy all kinds of oceanographic instruments (moorings/buoys/ship-based sensors etc.) within this harsh and remote environment. The science has since expanded to include all elements of the natural sciences – from sea ice thickness measurements to microbial population sampling.
I’ve been lucky enough to be invited to join this year’s expedition to support the planned sea ice observations. I hope you (and I for that matter) manage to learn something about fieldwork in the polar regions and how the results obtained from the cruise can and will be used by scientists seeking to understand this crucial yet poorly understood region of the global climate system.
Daily Blog Posts:
September 24, 2014: I’m writing from the Louis S St. Laurent – a Canadian coast guard vessel currently transporting a troupe (gaggle?) of scientists on a journey around the Beaufort Sea.
Why the Beaufort Sea? Well, the significant feature of the Arctic Ocean is the Beaufort Gyre – a clockwise, wind-driven, ocean circulation that stores a large volume of fresh water (mainly sourced from river run-off into the Arctic) through a process called Ekman convergence. Essentially the freshwater collects in the upper layer of the ocean (couple of hundred meters or so), as it is lighter than the saltier water below. The clockwise winds over the region then act to suck the freshwater inwards, causing a doming of the ocean surface (anti-clockwise winds would have the reverse effect).
Scientists have hypothesized that the release of this fresh water into the wider global ocean could significantly suppress ocean mixing. This has the potential to slow down the global overturning circulation which could, in-turn, trigger a (temporary) cooling effect. The ‘Great Salinity Anomaly’ of the 1970s, when the Atlantic Ocean freshened significantly, has been strongly linked with this very process.
Recent observations obtained from previous cruises (part of the same Beaufort Gyre Exploration Project) suggest the gyre released some of its freshwater a few years ago, following years of ‘spin-up’ and freshwater accumulation. Whether this release was anomalous or instead signified the start of a new regime of freshwater release from the Arctic is still unclear.
While changing winds are thought to be primarily responsible for the major shifts between freshwater accumulation and release; other processes are likely contributing also. Together with these circulation changes, the overlying sea ice cover is reducing in area, thickness and age. In-fact, the sea ice wind and ocean circulation are strongly coupled, as sea ice forms the interface between the atmosphere and ocean. Through my research at ESSIC, I am hoping to provide new insight into the coupling between the winds and sea ice motion – one (potentially crucial!) piece of this broader puzzle.
I’ll attempt to give you a bit more insight into the kind of science being carried out on-board in my next blog entry. But for now, thanks for reading…
Dr. Alek Petty – participant on the Beaufort Gyre Exploration Project research cruise (September 21st – October 16th)
September 27, 2014: We’re now a few days into the cruise and after the initial flurry of activity (setting up equipment, finding the canteen, being ‘initiated’ etc.) a more regular routine is starting to emerge. My primary responsibility for this cruise, together with Sam Thomas – my trusty sidekick, is to take hourly observations of the surrounding sea ice pack. This isn’t as simple as it sounds.
First, a quick lesson in sea ice formation:
As the ocean surface temperature drops below freezing, small crystals of ice form. Depending on the relative turbulence of the ocean, these crystals coalesce in various ways into continuous sheets of thin, grey (semi-transparent) ice. The new ice layer continues to grow, forming floes (circular sheets) of flat white ice – first year ice – and snow begins to accumulate on the surface.
These ice floes crash into each other under the combined influence of wind and ocean drag, with ridges of ice forming at the interface (think tectonic plates). If the ice survives the summer melt, these jagged ridges weather, smoothing out the ice surface. Melt ponds may also be found on the surface of older ice as the melt water produced through solar heating pools on the surface. As the ship breaks through the ice, the ice overturns and we can also make a rough estimate of ice thickness – another proxy for age.

I could bore (entertain?!) you forever with even-more detailed descriptions of ice type, but this should give you a bit of an idea about how we can try and identify the age/type of ice based on its surface appearance alone. While satellites provide us with a good understanding of the broader behavior of the sea ice cover, the results lack the fidelity required to really understand the various nuances between different sea ice types. That’s why these visual observations are still so important.
The ice type/age matters because it determines
the response of sea ice to wind and ocean currents. Thinner, less concentrated, ridged first-year ice, for example, drifts faster than the thicker, consolidated multi-year ice.
This all links back to the discussion contained in my previous blog entry – how much is the coupling between the winds, ice and ocean changing and what might this mean for the Beaufort Gyre? Hopefully these (somewhat painstaking) observations, taken since 2006, will provide us with some useful insight..!
Alek
October 6, 2014: As I stated in an earlier post, the vessel transporting us around the Beaufort Sea is the Louis S St. Laurent – the largest of the Canadian coast guard fleet (coming in at 119.63 m).
The Louis is an icebreaker – meaning it’s built to smash through the sea ice cover (or crawl if the ice is particularly thick). It features a rounded but relatively shallow thick steel hull, together with a narrow ice knife underneath, enabling it to carve through the ice before the shallow hull slides over and pushes its way through. While other icebreakers vary in their design, the Louis seems to be doing a pretty good job on this cruise, although it’s started to struggle a bit more in the last few days as we’ve encountered the thicker multi-year ice floes. The Louis is capable of navigating through very thick ice, however this costs time and money, meaning the crew navigate as best they can through open water cracks (leads) in the sea ice cover; utilizing near real-time satellite imagery (RADARSAT-2) of the surrounding region.
The Louis came into this world back in 1969. Originally used to patrol the shipping lanes north of Canada, she is now used primarily as a research vessel. The Canadian government recently commissioned multiple surveys of the Arctic continental shelf north of Canada, including the Losmonov Ridge (a shallow ocean seabed feature that extends right up to the North Pole), to collect information for its submission on Arctic Ocean ownership rights to the United Nations Convention on the Law Of the Sea (UNCLOS). The Louis (with the aid of another icebreaker) completed this expedition only days before we embarked. The rhetoric surrounding this surveying has been strongly nationalistic, with the media reporting on the ‘heroic’ and ‘vital’ work of these (fairly routine) seismic surveys. Repeated surveys are planned for next year. In-fact, the Canadian government recently confirmed their desire to keep the Louis running for another ten or so years (Chief Engineer, personal communication), taking it way beyond its original lifespan.
We’re clearly entering interesting and potential volatile times for the Arctic, with surrounding countries keen to take advantage of the increased mining and shipping opportunities available due to the diminishing sea ice cover. Whether Arctic sea ice scientists will be able to, or in-fact be forced to utilize these developments to maintain funding for their essential but costly fieldwork activities will be interesting to observe. Up to now, scientists have mainly spoken gloomily of the Arctic sea ice reductions, but this may be changing…
Alek
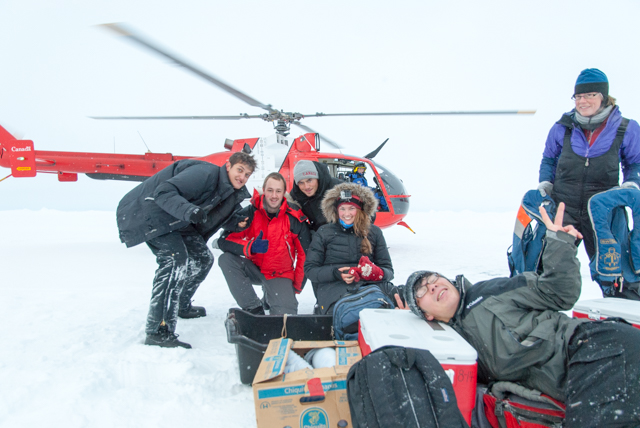
October 9, 2014: The Ice Station:
A couple of days back we had our first of the planned ‘Ice Stations’ – a day set aside for getting us scientists out on to the sea ice. The normal procedure is for the helicopter to fly a quick recce mission early in the morning to find a nice, thick looking ice floe (too thin and we might not make it back…). Unfortunately, the bad weather meant the helicopter wasn’t able to fly any real distance so instead the ship searched around and found something that looked reasonable. Rick (one of the senior scientists) went down and drilled a few holes through the ice, confirming it was indeed thick enough to support us and the several buoys they were hoping to deploy.
Once the ship was parked up they could lower the gangway – a much simpler, but somewhat less exciting operation than the planned flights. Considering, however, that a helicopter went down last year during a similar operation (albeit from a different Canadian research vessel), tragically killing the pilot and several scientists on-board (something I found out about at the start of this trip!), safety measures were, quite rightly, strictly enforced. The only thing left for us to genuinely worry about was a polar bear attack. Thankfully two of the crew were out with us, armed with some pretty serious looking shotguns, to protect us from any stealth attacks (those ice ridges I talked about previously provide the perfect hiding spot apparently). Suffice to say, no animals were harmed in the measuring of this ice floe.
The Ice Station itself was split into two. Firstly, the buoy deployment team headed onto the ice while the helicopter transported their equipment down in huge slings, with the team ducking and dodging out of the way as their shipments touched down. The buoys measure all elements of the sea ice system, from the mass, thickness, and velocity of the ice, to the fluxes of gasses through the ice. All the buoys add up to several hundred thousand dollars worth of kit, meaning the team were taking their jobs very seriously. We were under strict orders not to get in their way!

The second part of the Ice Station was the on-ice measurements, which myself and Sam were placed in-charge of. I organized the 100 m ice transect and Sam got things going with the ice coring. For the transects we measured the snow depth every meter (using a meter ruler, nothing fancy) and drilled through the ice every ten meters, measuring the ice thickness and freeboard (the distance from the ice surface to the water level within the drilled hole). Once this was finished we pulled along an EM (electromagnetic) sensor, which detects the strong conducting seawater directly below the ice (these sensors are mainly used to detect metal objects underground), to get a continuous measurement of the total thickness of the snow and ice along the same transect line. The drilled holes and snow depth are used to validate the output from the EM sensor, which can then be used to measure thickness over much greater distances (something we will hopefully do at the next Ice Station).
Our Japanese colleagues (Seita and Yasu) have their own EM sensor which they also took out on to the ice to validate their ship-borne EM which, in-turn, is used to validate their satellite derived ice thickness estimates. It’s great to see first-hand all these crucial steps that go in to producing estimates of Arctic sea ice thickness, the holy grail of sea ice science.
While I was doing this, Sam, along with his many willing helpers, was busy coring the ice. We received several requests for ice cores from the scientists on-board to aid their investigations into the internal properties of sea ice (including the gas, DNA and microbial content of the various ice layer
s). The only incident here was an essential piece of the ice corer being (accidently) dropped down one of the recently drilled holes. Thankfully the guilty person (not mentioning any names…) managed to pull this piece back out of the hole; ending our mild panic and allowing the coring to continue as planned.
Once these cores were completed our job for the day was over and we treated ourselves to a little game of sea ice soccer before retiring to the ship. The buoy team had to stay out for another hour or so, with the ship lighting up their site as the sun set (see photo!). They eventually finished up and joined us for a well-earned dinner. All in all this was a really fun and inspiring day of sea ice science. I’m starting to quite enjoy this fieldwork lark!
On a totally unrelated note, yesterday was both my birthday and my very first sighting of a polar bear! Observing the stampede of scientists all rushing to take a look was perhaps more interesting than the bear itself – but it was still cool to see this striking animal nonchalantly walk off into the distance, seemingly uninterested in the presence of this huge ship nearby. A big box ticked…
Alek
Ice Station 2:
A few days ago we tackled the second and unfortunately last of our planned ice stations (time constraints meant the third one had to be scrapped). The ice floe the ship parked up against looked a tad on the thin side, meaning the captain advised against the gangway we used at the previous station. We had to resort instead to the ‘the safer option’ – a helicopter landing on pretty thin ice. My excitement overcame any safety concerns I had! The rides down went smoothly (baring the snow storms generated when the helicopter landed) and we could get on with our measurements once again.

Worryingly, the thickness of one of our first drilled ice holes came in at 44 cm – on the boundary of what is normally considered safe to work on. Luckily we had a long pokey stick with us, which was used to bash down on the ice ahead of us to check it was safe to walk on. This wasn’t hugely scientific but it seemed to do the job (I’m still alive). Our time on the ice was pretty rushed as the team from Woods Hole only had a few buoys to deploy (they basically call all the shots while we’re out on the ice). Once we had finished the drilling they informed us we only had an hour left out on the ice. Sam sped up his ice coring accordingly and I ran around with my sled-borne EM, frantically grabbing some last minute thickness data. We just about finished our planned activities in time and the helicopter bought us back to the ship safe and sound. We managed to bring back several ice cores and a good amount of thickness data. The EM again performed admirably, meaning Mike, another scientific cruise member, will try and take it out with him when he heads out to the Northwest Passage (where ice thickness measurements are severely lacking but extremely crucial for navigation purposes) early next year.
Another thing I’ve been meaning to write about is our work with the XCTD deployment. Every few hours one of the Ice Watch team members are paged (yes, people still use pagers) and we head down to the aft of the ship, ready to launch what is essentially a disposable conductivity and temperature probe (the X stands for expendable).
This whole operation is ridiculously simple. The probe is placed into a launcher (which is itself attached to a nearby computer), which tests the probe and opens up a new file on the computer for storing the data collected. Once we get the OK from the bridge, we head right to the back of the boat, release the catch and the probe drops down (not really launched unfortunately) into the ocean below. These probes are particularly useful because the hinged copper cable that remains attached to the computer on-board allows the boat to keep moving (albeit at a slightly slower pace) while the data is continuously uploaded. The whole process only takes about 5 minutes and provides instant information on the temperature and salinity of the ocean down to 1000 m. Pretty neat huh! These data can then be used to assess the freshwater content of the Beaufort Gyre – a crucial climate variable I talked about back in my first post. We’re all really eager to see what this year’s data looks like compared to previous years.

That’s all from me for now. We only have a few days left at sea so there should be time for one more post before I return home.
Alek
The End:
A few days back, our research cruise around the Beaufort Sea sadly came to an end. I’m a bit late in writing this as, on returning home, I immediately flew off to a meeting in Boston (the FAMOS meeting) on, funnily enough, the Arctic Ocean. Science stops for no one it seems.
The final days of the cruise saw us frantically collating our datasets, writing up cruise reports and packing up our bags. Luckily we also had a bit of time to relax and enjoy each others company, especially at the end of cruise Halloween party. We were obviously encouraged to dress nautically (my Poseidon effort left quite a bit to the imagination…). This was a great chance to unwind and thank the crew and scientists for what was a great month out at sea.
So what did we get out of the cruise? Well, we’re still pouring through our visual observations to see what the story might be there. As I said previously – the challenge is trying to ascertain the extent to which these observations provide new and useful information over and above the satellite/airborne sea ice datasets. We ended up seeing less multiyear ice (ice that is more than two years old) than expected, despite our late transit through the northern Beaufort Sea where multiyear ice is thought to be prevalent. The RADARSAT imagery showed us that the ice was quite broken up in this region, meaning the ship was able to navigate quite comfortably through extended leads (openings) in the ice pack, keeping us out of the really thick, old ice that we came across more sporadically.

The freshwater content of the Beaufort Gyre, produced virtually instantaneously from the raw CTD data collected on the cruise, showed an interesting increase this year compared to last. My earlier comments about the ‘spin-down’ of the gyre and the potential release of some of the freshwater might have been somewhat overstated it seems! I’ll say that this simply highlights how difficult a job it is to predict/understand climate phenomena on annual time-scales, especially considering the various processes that all contribute to this gyre’s freshwater content. Indeed, a fairly senior scientist at the meeting I just attended (whose name I shall not mention) referred to the release of freshwater a few years back as more of a ‘burp’ than the full on release/regime shift that was predicted by some. Why the freshwater content showed an increase this year is still unclear, however, high sea ice melt in the vicinity has been touted as one potential contributor. Hopefully some of the data collected this year will provide more of a thorough answer.
I’d like to finish by commenting that, as clichéd as it sounds; this cruise has given me a real understanding of both the beauty but also the complexity of sea ice. As someone that has now attempted to understand sea ice using both climate models and satellite sensors (we’re trying to measure something a few meters thick from space!), witnessing sea ice’s complexity is almost disheartening. The ridges, the melt ponds, the young ice formation, the complex snow cover – not one of these variables are well understood. Similar to the freshwater discussion, we clearly have a long way to go before we can fully grasp how sea ice behaves in both a mean sense and in response to continued global warming. But hey, sounds like a worthy challenge to me.
Alek
Thanks for reading!
")