
Weather Predictability
This event has passed. See the seminar recording here: Dr. Richard Rotunno National Center for Atmospheric Research Monday November 15, 2021, 2 PM ET
")
This event has passed. See the seminar recording here: Dr. Richard Rotunno National Center for Atmospheric Research Monday November 15, 2021, 2 PM ET
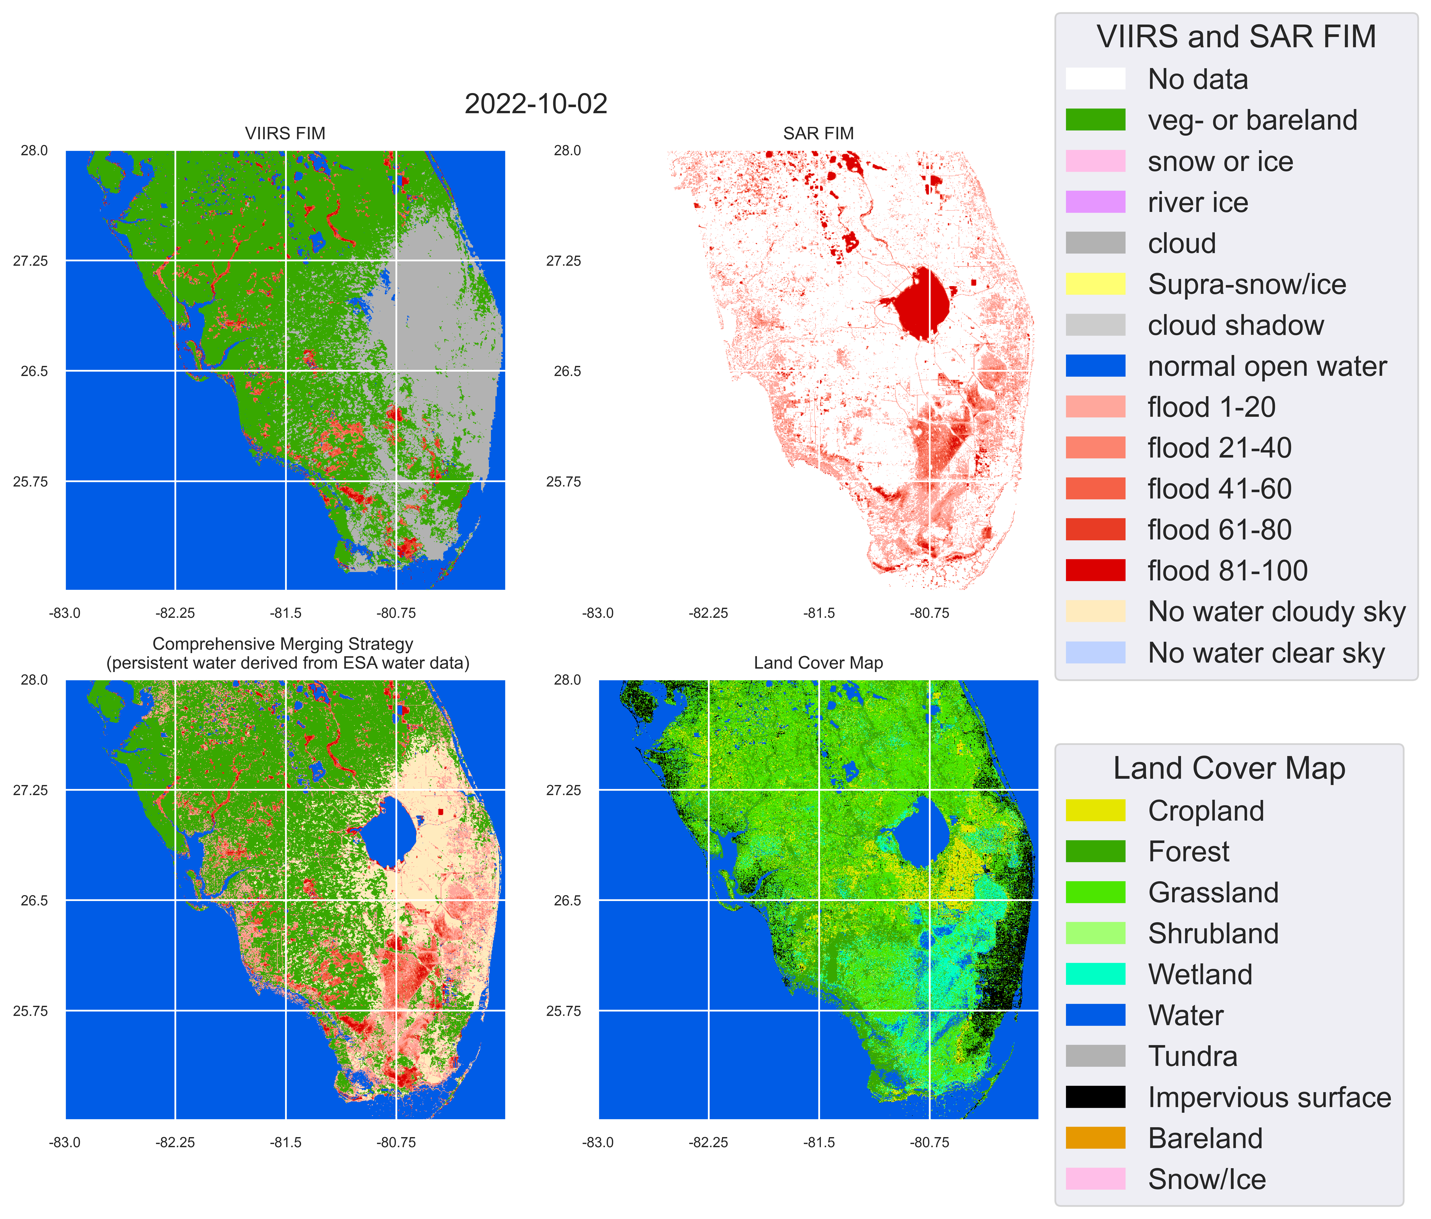
Hurricane Ian made landfall in Florida on the afternoon of 9/28/2022 as a massive Category 4 storm and brought record-setting winds. As of 10/4/2022, at least 105 people have been reported as casualties of Hurricane Ian, 55 of which in Lee County, Florida. Even more people are without power or their home. The NOAA STAR Flood team has produced VIIRS Flood maps, Sentinel-1 SAR Flood maps, and blended Flood maps to report the flood extent due to Hurricane Ian.
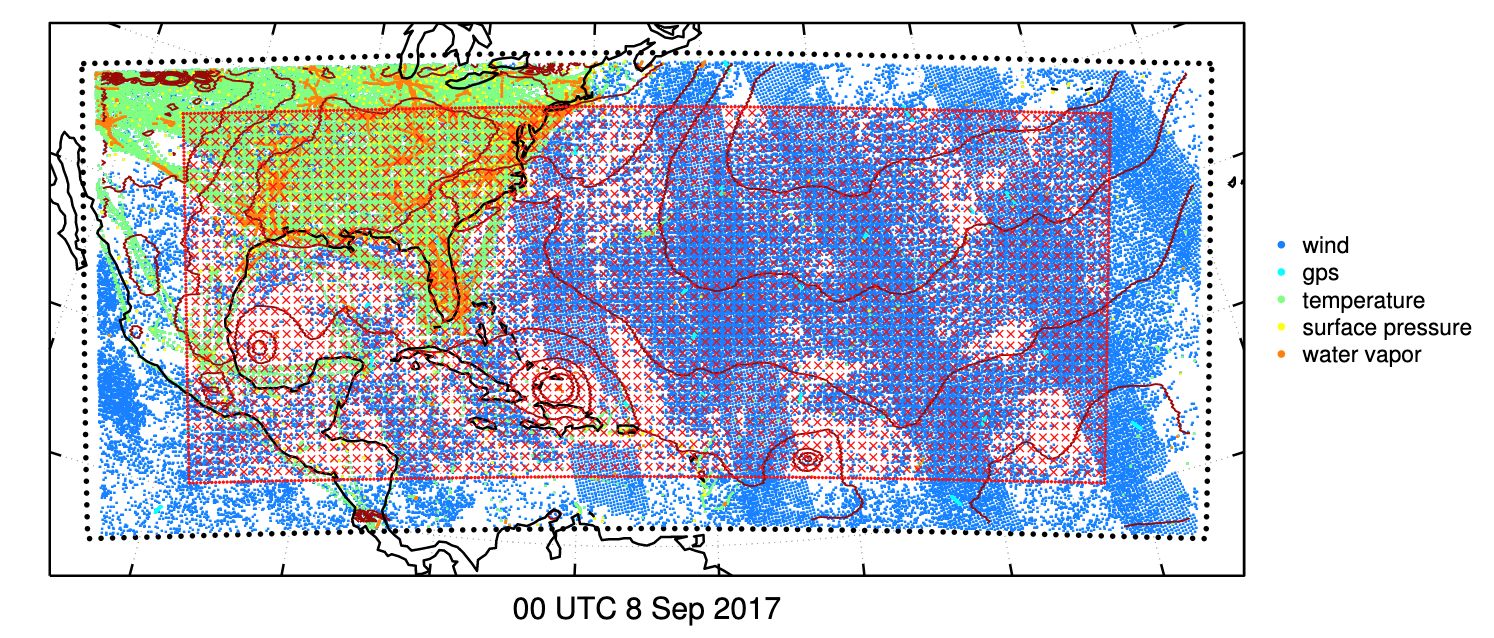
ESSIC/CISESS Scientist and Department of Atmospheric and Oceanic Science Professor Dr. Jonathan Poterjoy has recently examined the fidelity of error assumptions made by regional weather prediction systems using a novel technique that avoids common approximations.
The National Oceanic and Atmospheric Administration’s Climate Prediction Center (CPC) launched a new look and feel to some of their long-range U.S. temperature and precipitation forecast maps on September 15, 2021. As part of the National Weather Service’s suite of official forecast products, these maps are widely used by weather forecasters, media outlets and decision-makers whose industries rely on accurate weather information.
