Tag: Satellite Calibration and Validation

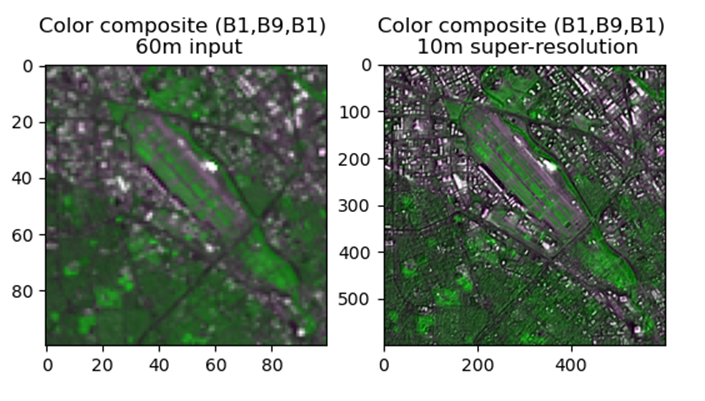
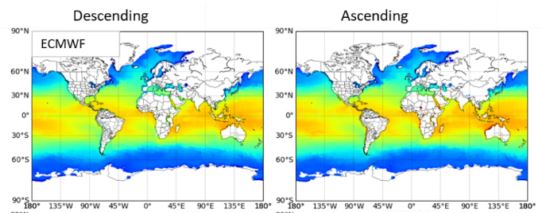
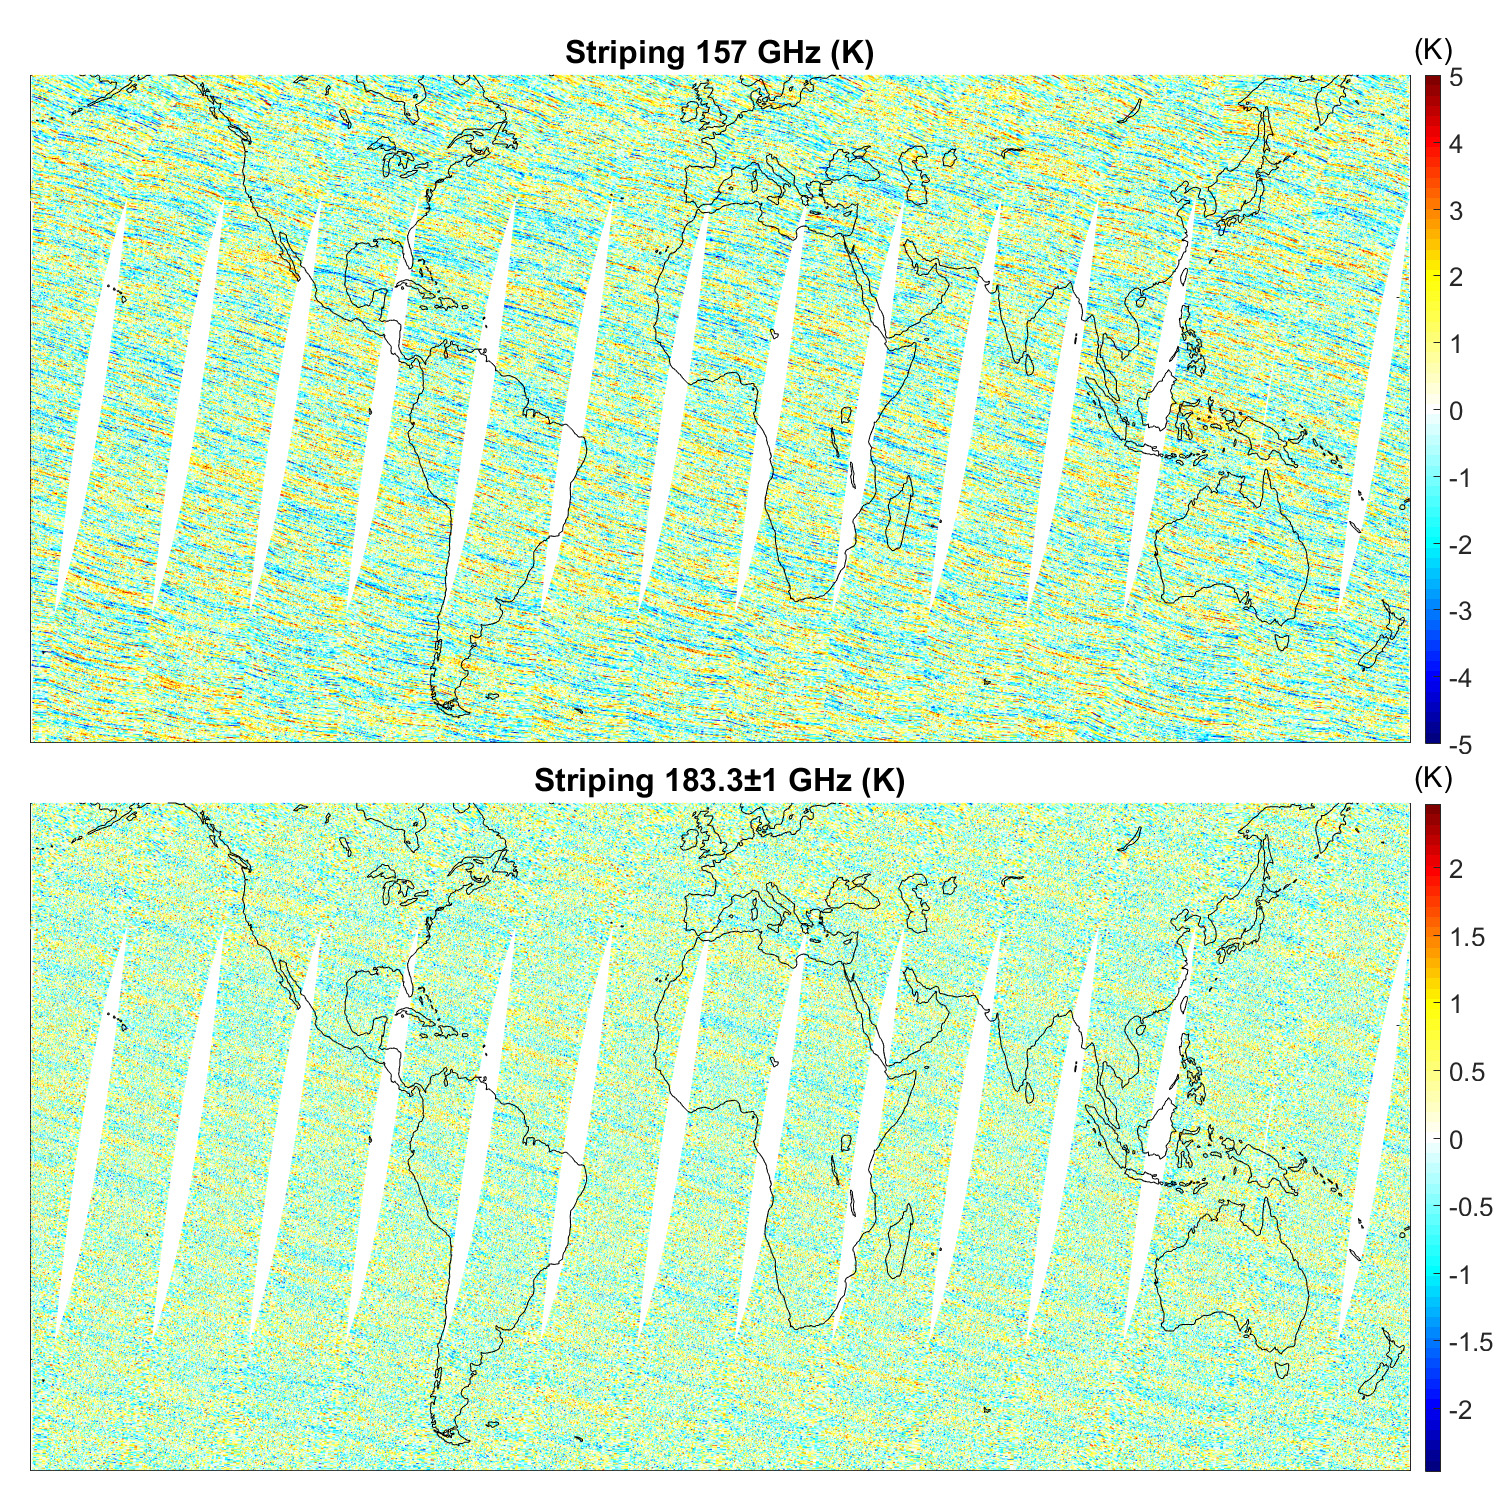
Striping of MetOp-A MHS on July 1, 2019

Quantifying and Characterizing Striping of Microwave Humidity Sounder With Observation and Simulation

ESSIC/CISESS scientists John Xun Yang, Yalei You, and Rachael Kroodsma are co-authors on a new paper in IEEE Transactions on Geoscience and Remote Sensing alongside Sidharth Misra from NASA Jet Propulsion Laboratory and William Blackwell from MIT Lincoln Laboratory. Blackwell is also a two-time speaker for the ESSIC Seminar Series, the most recent of which can be viewed here.

Read More »
A screenshot of all attendees of the virtual meeting, smiling into their webcams!

Fangfang Yu Leads Global Space-based Inter-Calibration System Meeting

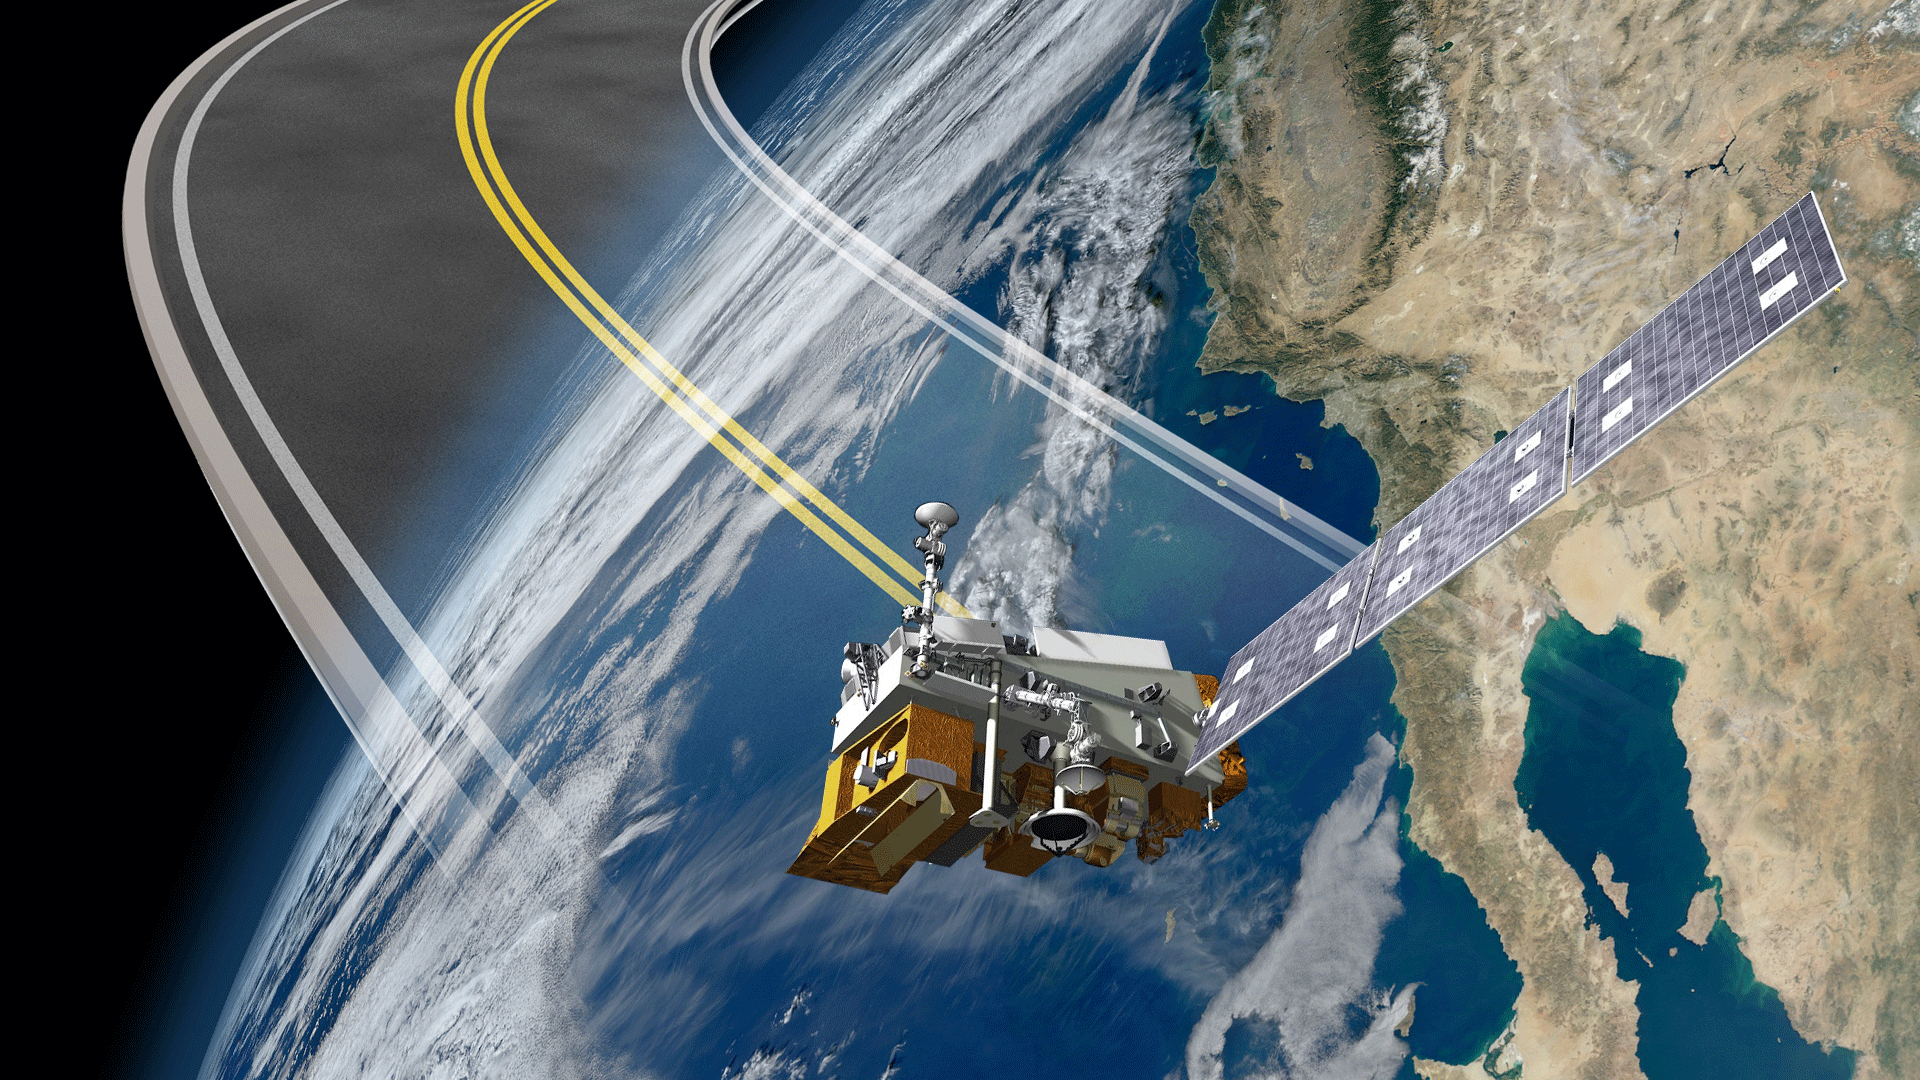
The 2022 Annual Global Space-based Inter-Calibration System (GSICS) meeting was successfully held online on 10 March 2022 and 14 – 18 March 2022. Dr. Fangfang Yu, ESSIC/CISESS Associate Research Scientist and new presiding chair of the GSICS Research Working Group (GRWG), led the effort to organize the meeting with the help of the GSICS Coordination Center (GCC) and GRWG members.

Read More »
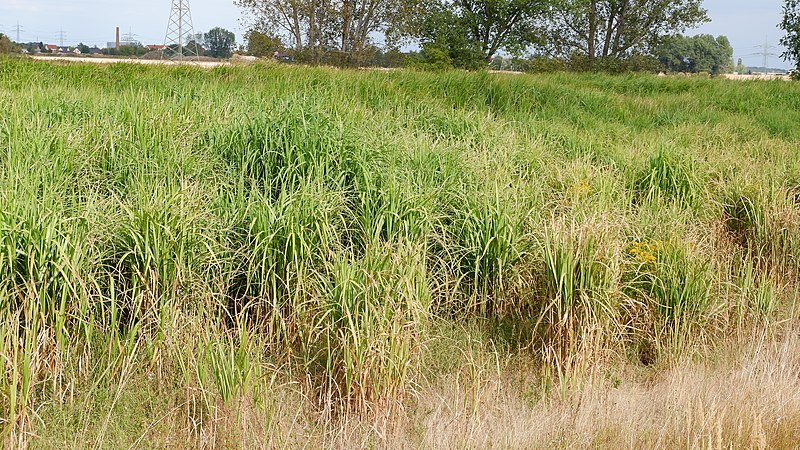
Giant miscanthus can grow up to 3-4 meters.

Growing This Plant Could Mitigate Climate Change in the Midwest

A new study including ESSIC scientist Xin-Zhong Liang has discovered that growing Miscanthus + giganteus, a type of perennial biomass crop, has a strong likelihood of significantly lowering regional summer temperatures and the vapor-pressure deficit, while increasing rainfall and overall crop productivity. This work was published in Global Change Biology-Bioenergy with Liang serving as Lead Principal Investigator. The first author, Yufeng He, is a former ESSIC Postdoctoral Associate.

Read More »
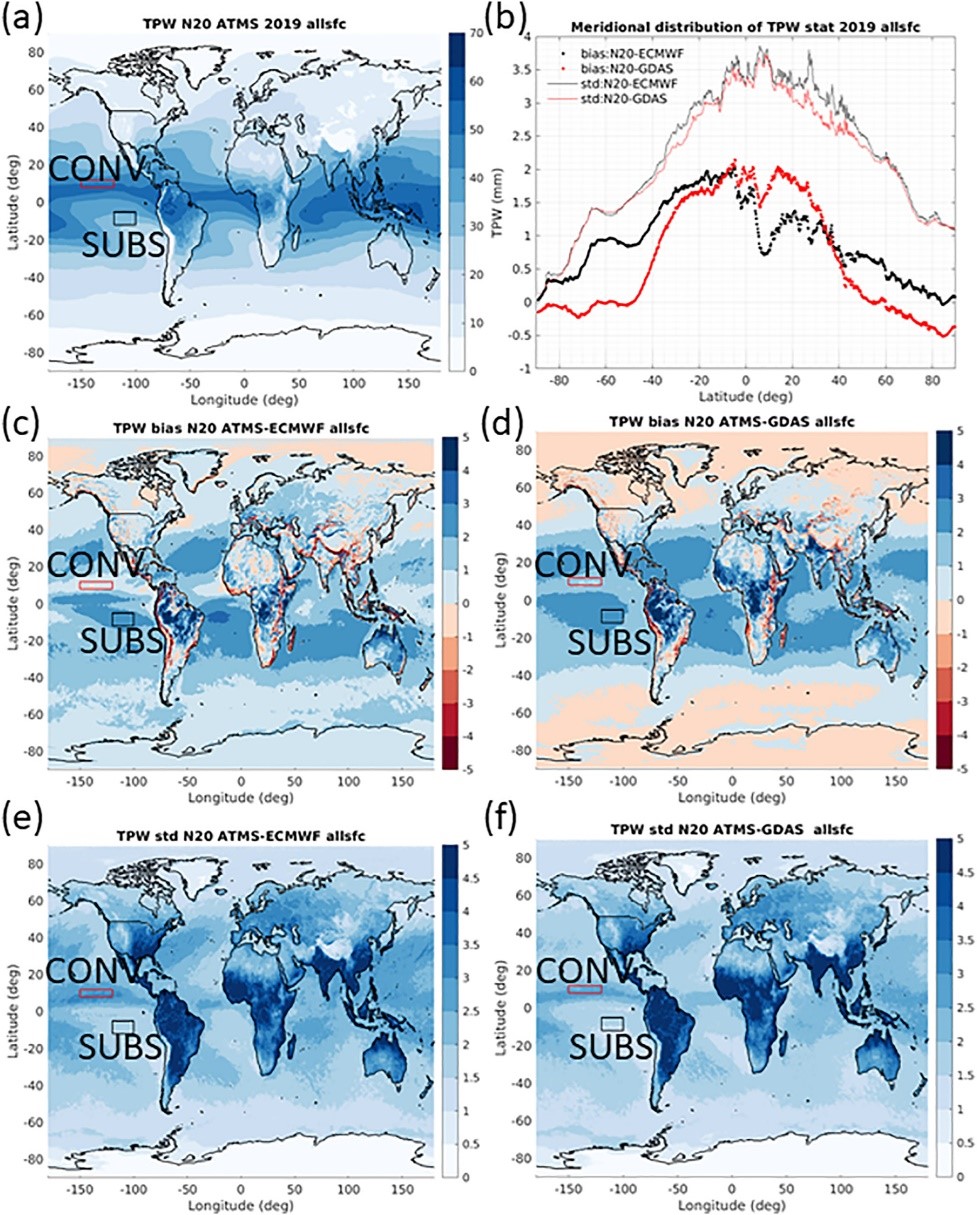
Figure 1. (a) Horizontal distribution of MiRS NOAA-20 ATMS TPW for all of 2019, (b) meridional distribution of statistics for MiRS NOAA-20 ATMS TPW versus ECMWF (black) and GDAS (red) (dots are bias (mm) and lines are standard deviation (mm)): number of pixels are more than 1.2 million for each latitude between 80°S and 80°N. Beyond this area the number of pixels decreases significantly. Global distribution of bias (mm) of (c) MiRS NOAA-20 ATMS TPW – ECMWF TPW, (d) MiRS NOAA-20 ATMS TPW – GDAS TPW, standard deviation (mm) of MiRS NOAA-20 ATMS TPW versus (e) ECMWF TPW and (f) GDAS TPW. All results are for combined ascending and descending orbits in 2019. The red box (120°W ∼ 150°W & 8°N ∼ 12°N) in each plot indicates an area typically characterized by strong convection (CONV area) and the black box (100°W ∼ 120°W & 5°S ∼ 12°S) indicates an area typically dominated by subsidence (SUBS area).

In-Depth Evaluation of MiRS Total Precipitable Water From NOAA-20 ATMS

The MiRS Science Team, composed of ESSIC/CISESS scientists Yong-Keun Lee and Christopher Grassotti, as well as NOAA STAR scientist Mark Liu, published a paper this week titled “In‐Depth Evaluation of MiRS Total Precipitable Water From NOAA‐20 ATMS Using Multiple Reference Data Sets” in Earth and Space Science. Lee was the first author of the study.

Read More »
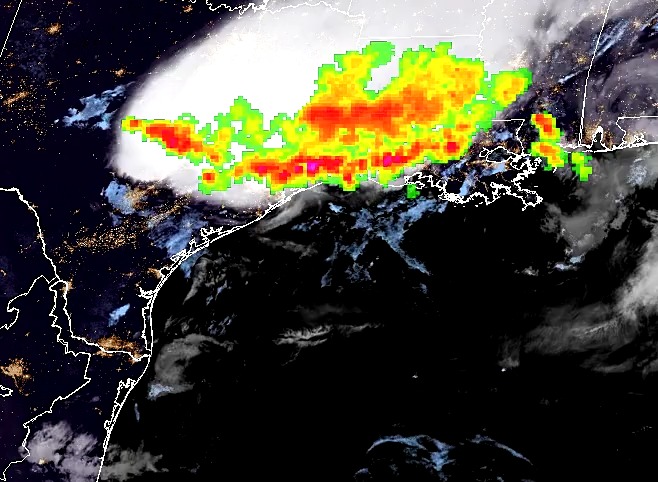
A visualization of the longest lightning flash

Watch the Longest Lightning Flash Ever

The ESSIC/CISESS Geostationary Lightning Team team, which includes Scott Rudlosky and Daile Zhang, have released a new ArcGIS Story Map via the NOAA GeoPlatform titled “Longest Lightning Flash Ever?”. This website provides stunning visualizations of a recently documented world record flash that covered a horizontal distance of 768 km (477.2 miles) on April 29, 2020. This is equivalent to the distance between New York City and Columbus, Ohio. This flash was recently certified as the longest single flash world record, as covered in an ESSIC press release.

Read More »