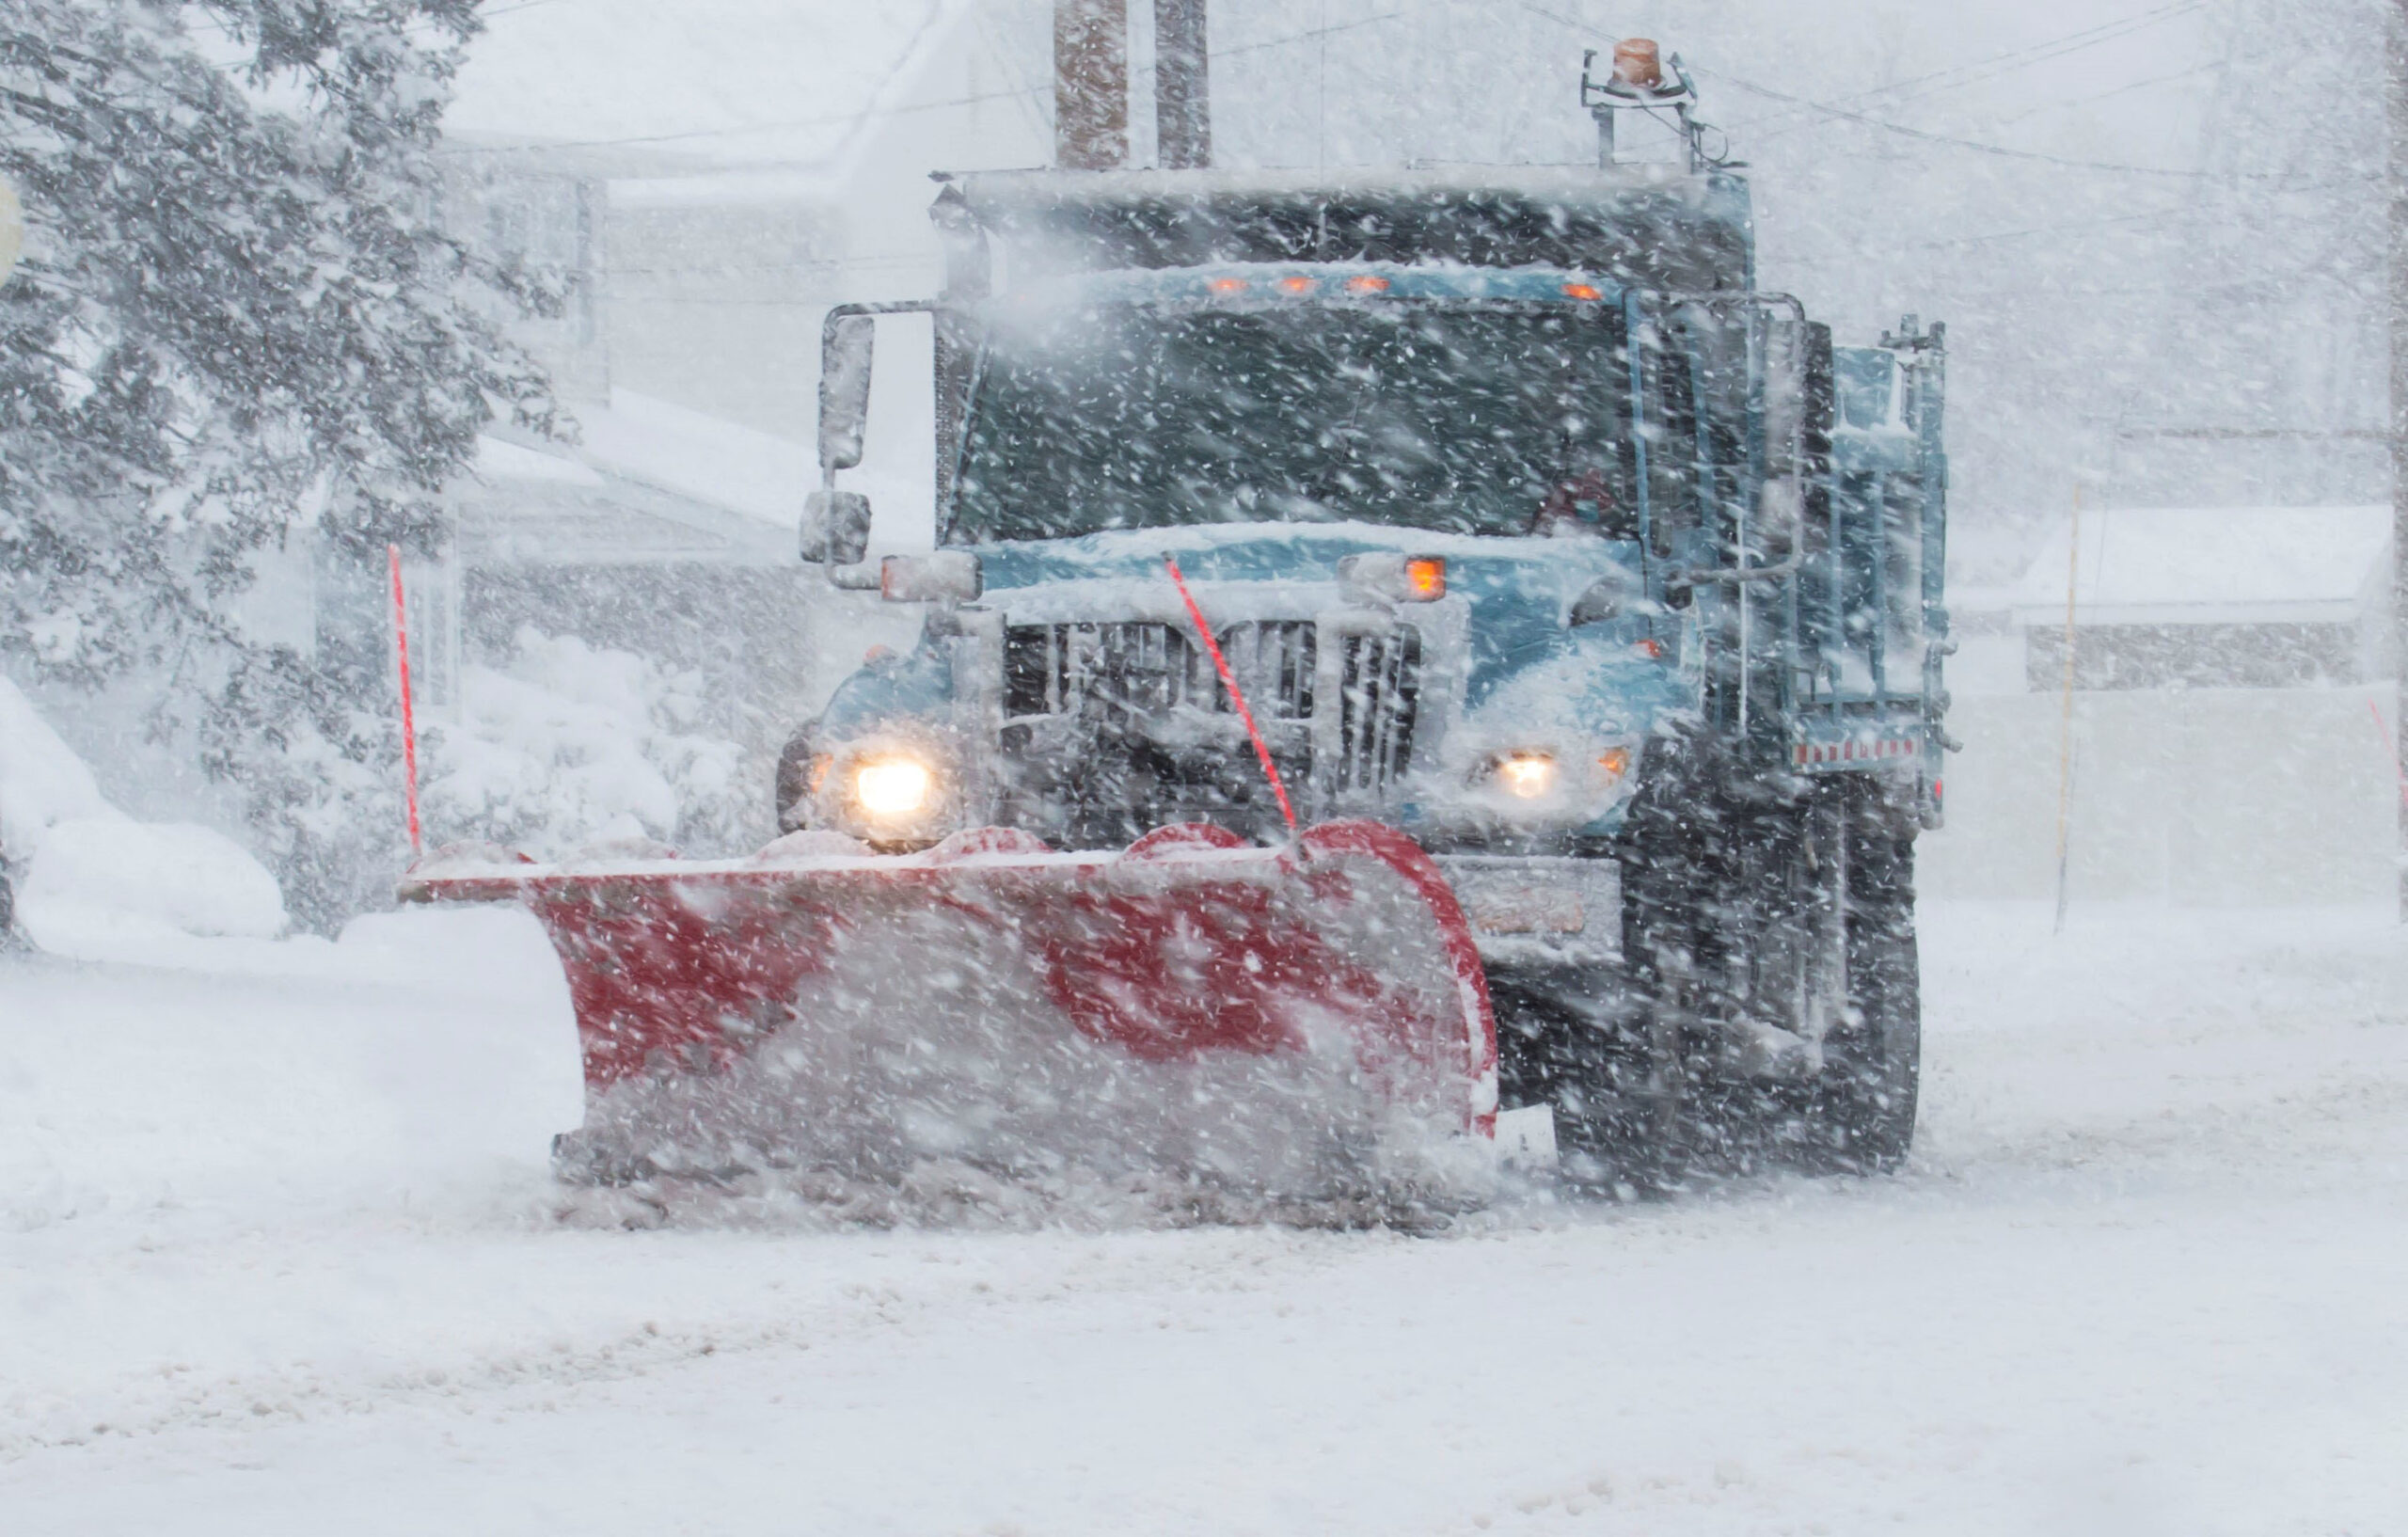
Fan Tracks the 2025 New Year Blizzard
ESSIC/CISESS Scientist Yongzhen Fan used the NOAA/NESDIS Snowfall Rate (SFR) product to give a timely update on Winter Storm Blair, the new year’s significant and
")
ESSIC/CISESS Scientist Yongzhen Fan used the NOAA/NESDIS Snowfall Rate (SFR) product to give a timely update on Winter Storm Blair, the new year’s significant and
Chris Smith, ESSIC/CISESS Faculty Assistant, has been posting updates on hurricane activity on the Satellite Liaison Blog, a blog for scientists to demonstrate how satellite
Download Headlines La Nina pattern of tropical anomalies not obvious, although the Nino 3.4 index was -0.4 at the end of September Dry conditions
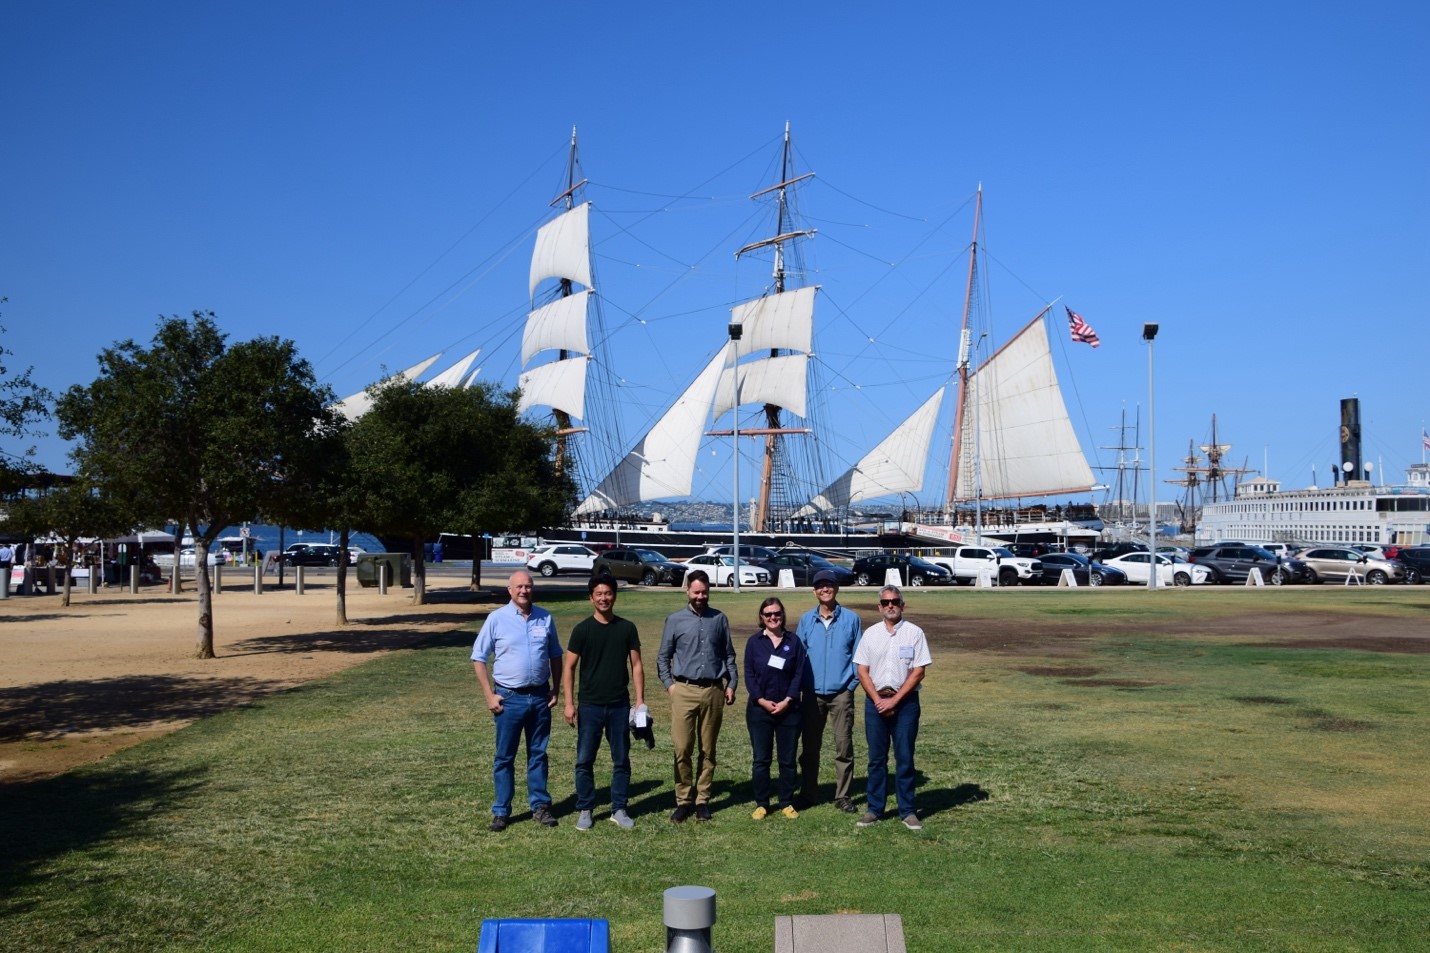
Figure 1- Chris Kidd, Toshi Matsui, Veljko Petkovic, Lisa Milani, Kwo-Sen Kuo, Ralph Ferraro ESSIC scientists participated at the annual meeting of the PMM Science

On September 5, ESSIC/CISESS scientist Veljko Petković presented the second seminar of the season at the Department of Atmospheric and Oceanic Science, a talk entitled
Download Headlines After a hot Northern Hemisphere summer, global precipitation for August remains just above average The tropical rainfall anomaly pattern for August shifts
This week, the American Meteorological Society (AMS) released its annual State of the Climate report in 2023. Compiled by NOAA’s National Centers for Environmental Information,
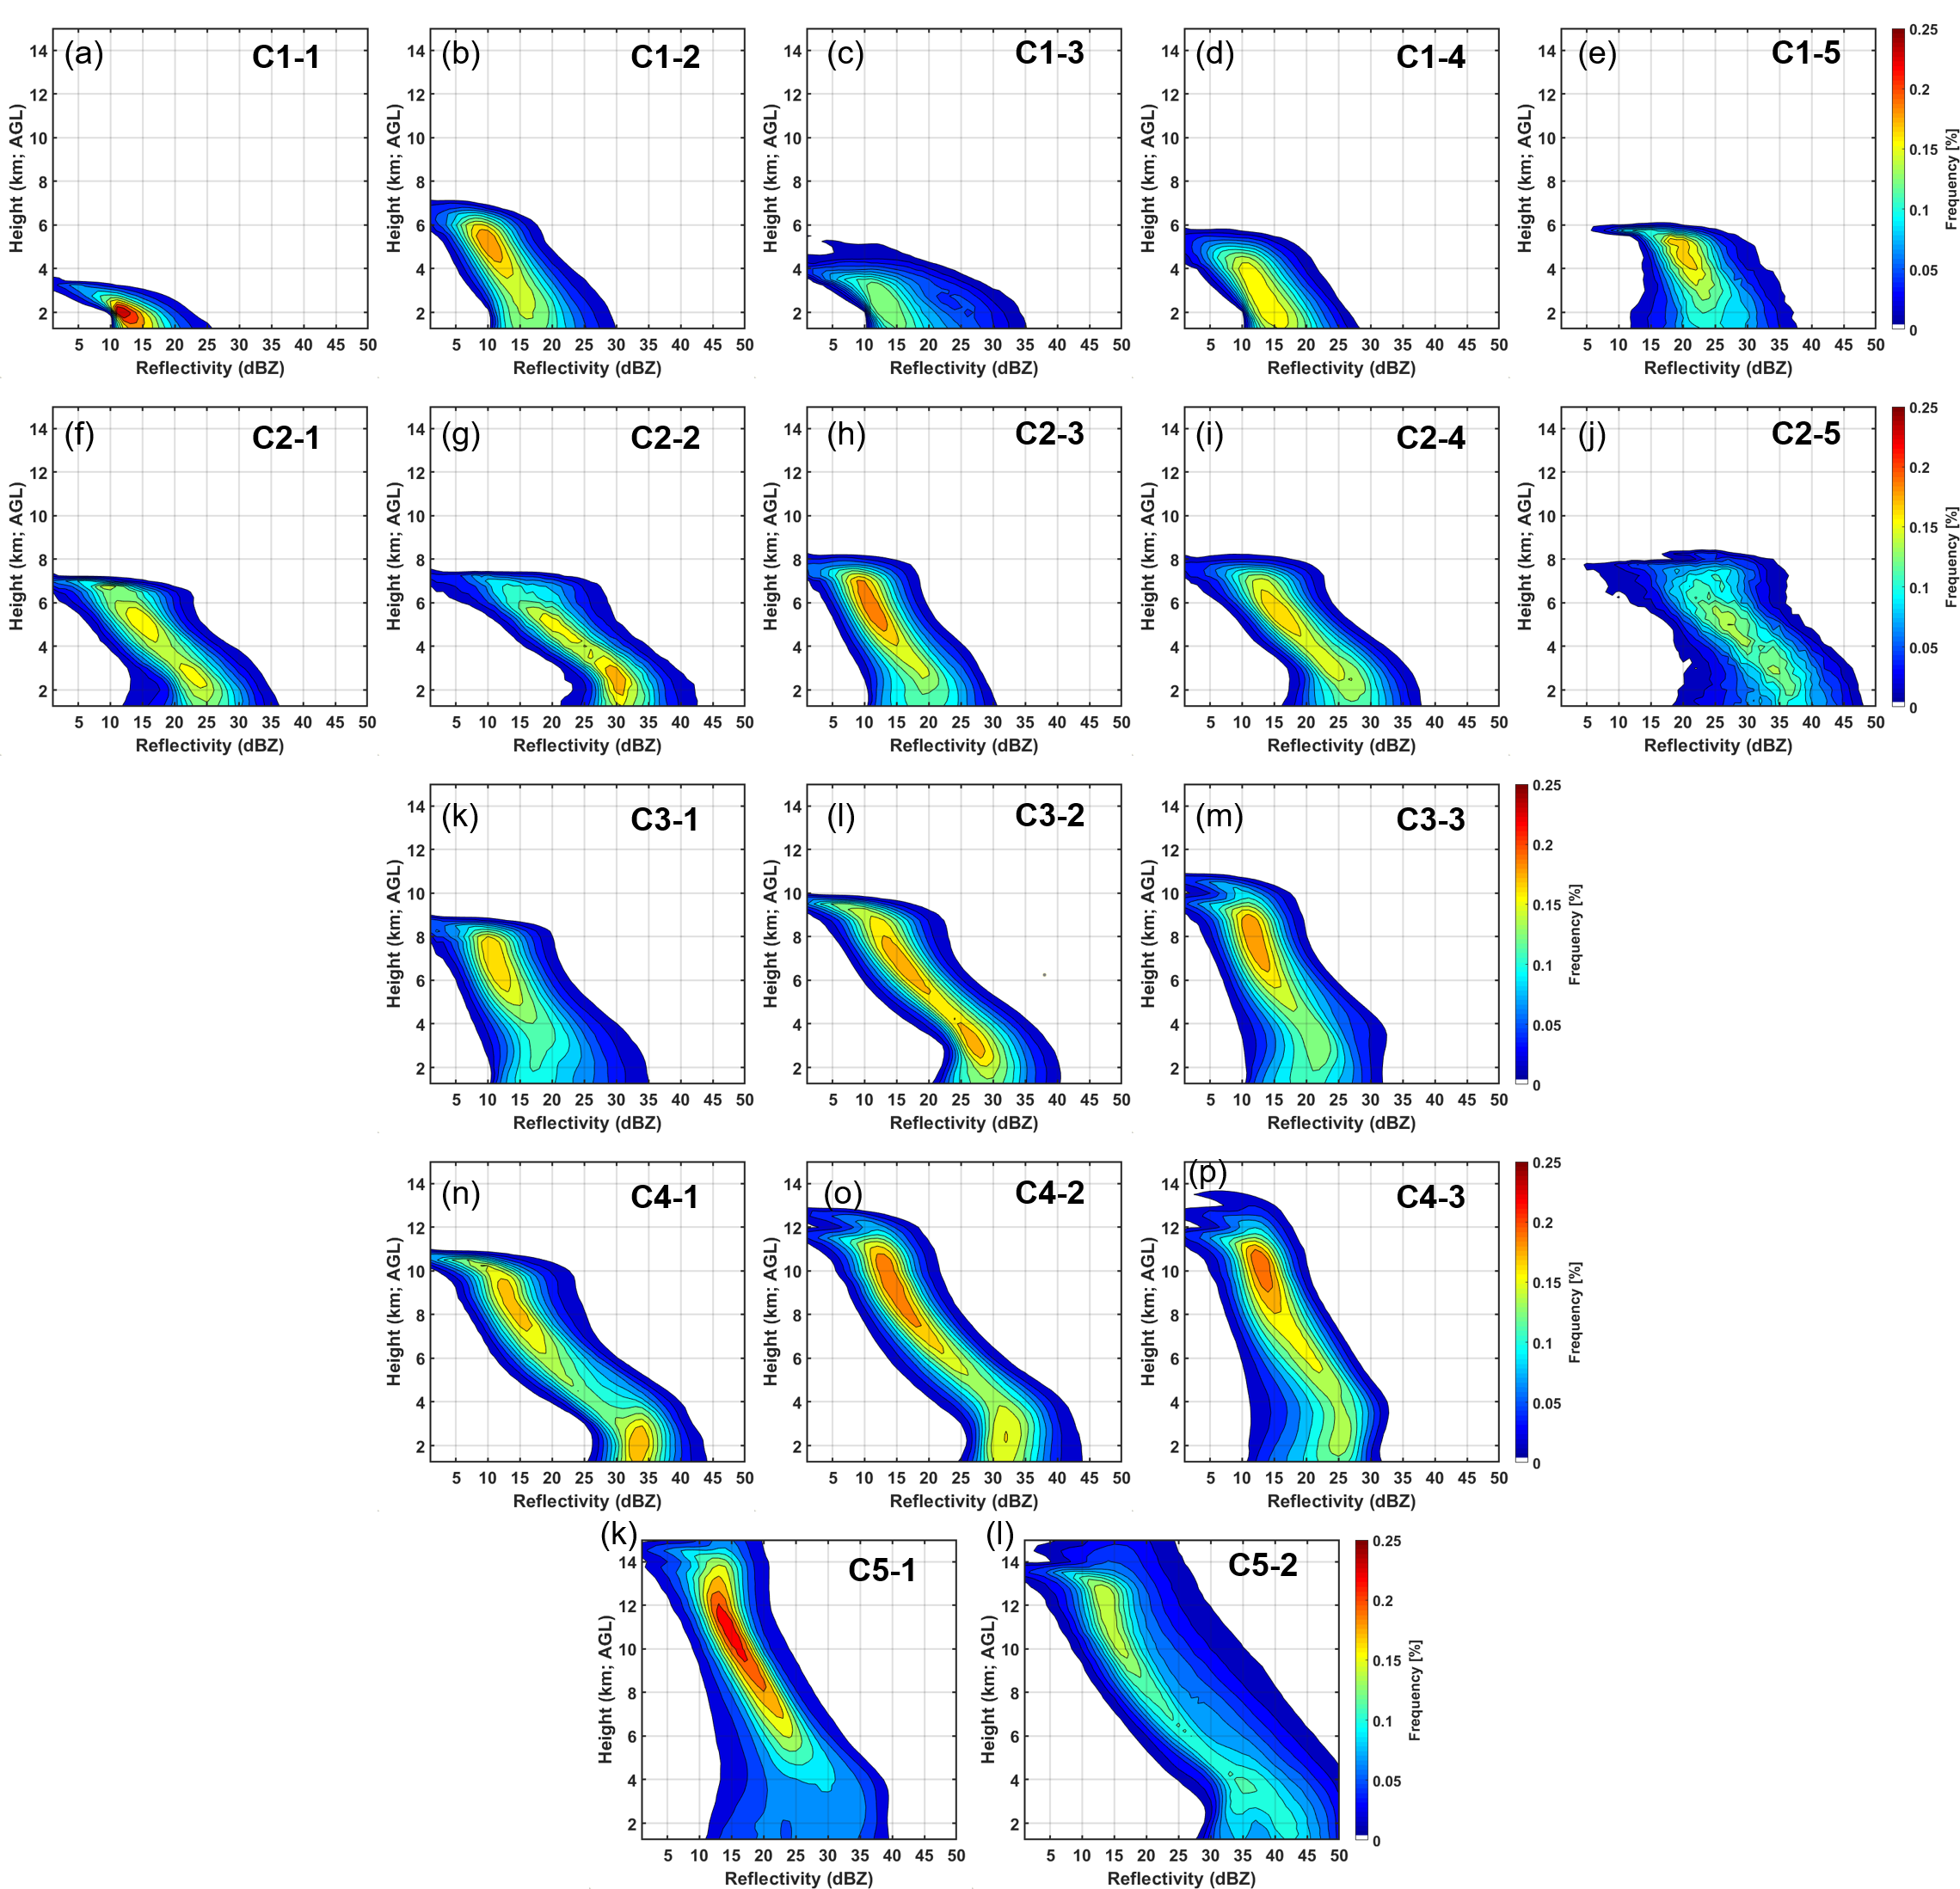
ESSIC/CISESS scientists Malarvizhi Arulraj, Veljko Petkovic, Ralph R. Ferraro, and Huan Meng have a new study out in Journal of Hydrometeorology titled, “Precipitation Vertical Structure Characterization: A Feature-Based Approach”.
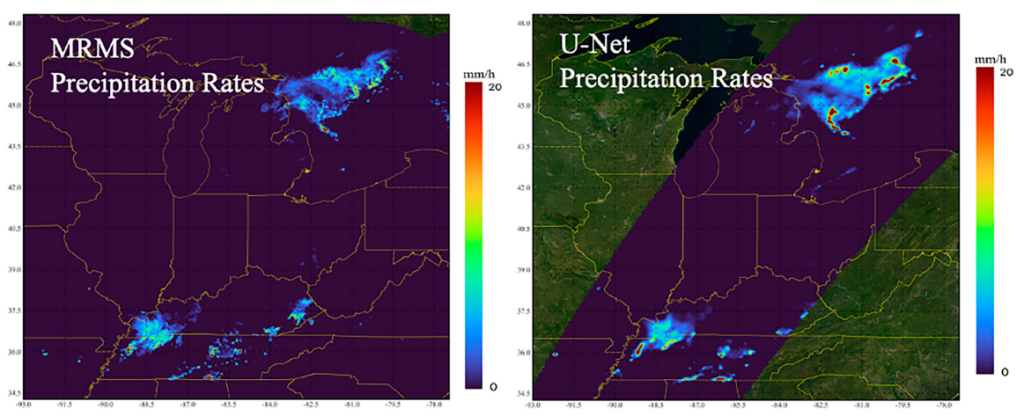
ESSIC/CISESS Scientists Veljko Petković, Malarvizhi Arulraj, and CISESS Summer Intern Vesta Gorooh (UCI PhD student) have a new article in the November issue of the Journal of Hydrometeorology. The article describes the use of machine learning techniques to improve the retrieval of surface precipitation from passive meteorological sensors aboard geosynchronous Earth-orbiting (GEO) and low Earth-orbiting (LEO) satellites.
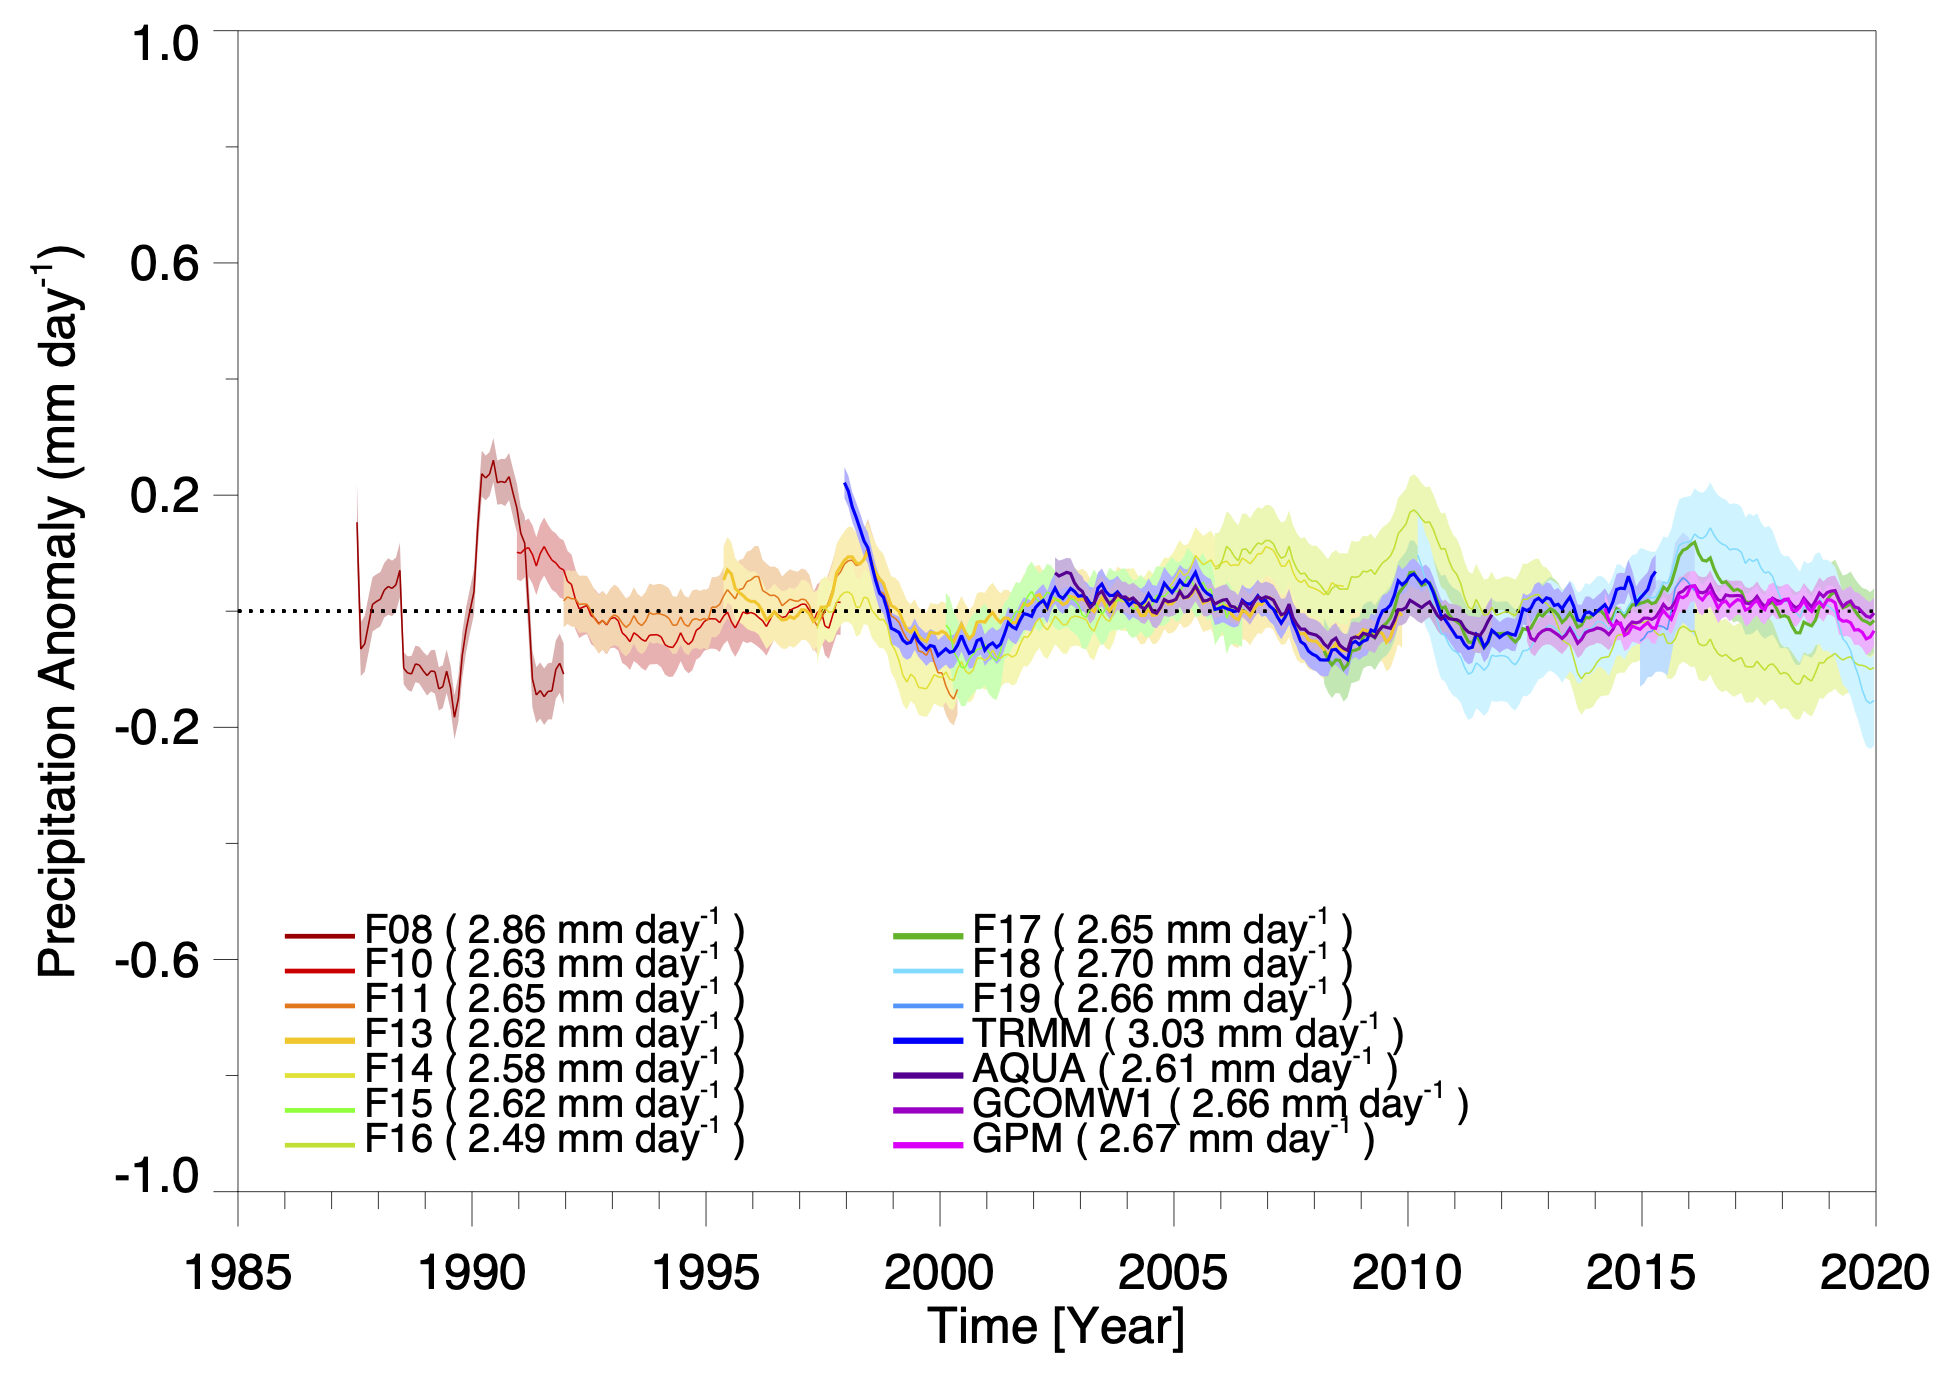
Veljko Petković is first author on a new paper in Journal of Applied Meteorology and Climatology titled, “Can We Estimate the Uncertainty Level of Satellite Long-Term Precipitation Records?”.
