Home » NOAA » Page 2

Tag: NOAA

A New NOAA Blended Soil Moisture Product that Does Not Rely on Model Climatology

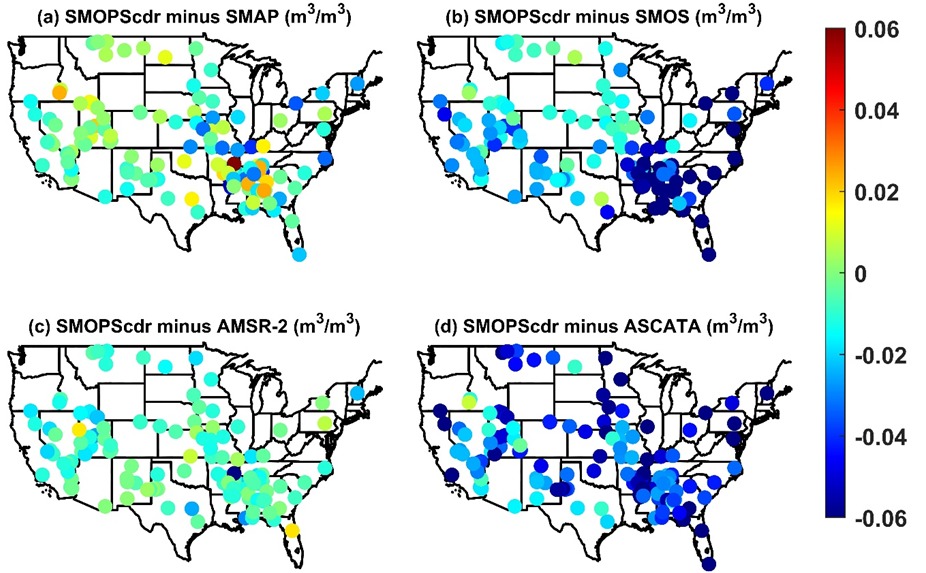
ESSIC/CISESS Scientists Jifu Yin, Jicheng Liu and Ralph Ferraro published a new article last month that discussed their work with NOAA’s Soil Moisture Operational Product System (SMOPS). SMOPS is developed by National Oceanic and Atmospheric Administration (NOAA) to provide the real time blended soil moisture (SM) for Numeric Weather Prediction and National Water Model applications.

Read More »

NOAA/NCEI Blended Sea Surface Winds Product for Resolving Hurricane Winds

ESSIC/CISESS Scientist Korak Saha and collaborator Huai-min Zhang have been improving the NOAA/NCEI Blended Seawinds (NBS) product. NBS blends several satellite estimates of surface wind, providing more accurate and gap-free observational data for model calibration and quality control. NOAA has been producing a global gridded 0.25-degree and 6-hourly sea surface winds product that has wide applications in marine transportation, marine ecosystem and fisheries, offshore winds, weather and ocean forecasts, among others.

Read More »
A coral, severely bleached to white

NOAA Coral Reef Watch Provides Critical Early Warnings for the 2022 Mass Coral Bleaching Event on the Great Barrier Reef

For more than 20 years, NOAA Coral Reef Watch (CRW) has been the world’s leader in observing, predicting, and communicating changes in the coral reef environment to a diverse, global user community. In mid-December 2021, CRW’s daily global 5km-resolution satellite coral bleaching heat stress products detected a significant build-up of oceanic heat stress on the Great Barrier Reef (GBR), Australia. This signified the GBR was starting its 2021-2022 summer season with a much earlier onset of accumulated heat stress than ever recorded before. At the same time, CRW’s modeled Four-Month Coral Bleaching Heat Stress Outlook indicated the significant heat stress would continue, leading to a potential mass coral bleaching event on the GBR (following on the heels of confirmed mass bleaching events in 2016, 2017, and 2020).

Read More »
Figure 1. (a) Horizontal distribution of MiRS NOAA-20 ATMS TPW for all of 2019, (b) meridional distribution of statistics for MiRS NOAA-20 ATMS TPW versus ECMWF (black) and GDAS (red) (dots are bias (mm) and lines are standard deviation (mm)): number of pixels are more than 1.2 million for each latitude between 80°S and 80°N. Beyond this area the number of pixels decreases significantly. Global distribution of bias (mm) of (c) MiRS NOAA-20 ATMS TPW – ECMWF TPW, (d) MiRS NOAA-20 ATMS TPW – GDAS TPW, standard deviation (mm) of MiRS NOAA-20 ATMS TPW versus (e) ECMWF TPW and (f) GDAS TPW. All results are for combined ascending and descending orbits in 2019. The red box (120°W ∼ 150°W & 8°N ∼ 12°N) in each plot indicates an area typically characterized by strong convection (CONV area) and the black box (100°W ∼ 120°W & 5°S ∼ 12°S) indicates an area typically dominated by subsidence (SUBS area).

In-Depth Evaluation of MiRS Total Precipitable Water From NOAA-20 ATMS

The MiRS Science Team, composed of ESSIC/CISESS scientists Yong-Keun Lee and Christopher Grassotti, as well as NOAA STAR scientist Mark Liu, published a paper this week titled “In‐Depth Evaluation of MiRS Total Precipitable Water From NOAA‐20 ATMS Using Multiple Reference Data Sets” in Earth and Space Science. Lee was the first author of the study.

Read More »
Frank Monaldo in the video

NASA/NOAA Tech Will Aid Marine Oil Spill Response

As part of the NASA grant, UMD, NASA Jet Propulsion Laboratory, NOAA, United States Coast Guard, Watermapping Ltd., Maryland Department of Agriculture, Environment Canada, and Marine Spill Response Corporation participated in an experiment to compare oil thickness measurements (both in situ and remotely) in the hopes of validating an oil thickness product. By finding the thickest oil layers, researchers can identify key zones to bring in remediation equipment and clean up the most harmful oil in the environment. ESSIC Senior Faculty Specialist Frank Monaldo is involved in this field work and is featured in a video that highlights this work.

Read More »

VIIRS Capable of Detecting Shipping Container Backlog in Light of Supply-Chain Challenges

ESSIC/CISESS Senior Faculty Specialist Yan Bai is a part of a NOAA Center for Satellite Applications and Research (STAR) project alongside Changyong Cao, STAR/SMCD/SCDA. The scientists found that VIIRS imaging bands can detect shipping containers at ports under clear sky conditions, despite its moderate resolution and the weak signal. This may enable them to monitor the port activities such as shipping container backlog in light of supply-chain challenges as widely discussed in the media. Figure 1 shows that more than 50 ships were found in the port of Los Angeles on October 1, 2021, compared to about a dozen two years ago, which indicates a potential backlog on that day.

Read More »
Figure 1. MiRS NOAA-20/ATMS retrieved TPW (descending and ascending orbits) on 24 October 2021 over the eastern Pacific and West Coast region. The atmospheric river is clearly seen. Locations of the four vertical cross-sections shown in Figure 2 are indicated by the dashed lines.

NOAA’s MiRs Captures Category 5 Rainfall Event in California

On October 24, a powerful Category 5 (the maximum possible) atmospheric river (AR) occurred over the northern and central parts of California. The storm system featured record breaking precipitation, leading to flooding and mudslides in some locations, along with dangerous winds exceeding 70 miles per hour at higher elevations. San Francisco recorded its fourth highest single-day rainfall amount of over 4 inches. Satellite passive microwave measurements are one of the observational tools that allow depiction of these extreme events, since microwaves are less affected by clouds and precipitation.

Read More »
Official U.S. government maps for long-range weather and climate predictions get a facelift with the help of data visualization experts.

UMD Scientists Help Put a New Face on National Weather Service Forecast Maps

The National Oceanic and Atmospheric Administration’s Climate Prediction Center (CPC) launched a new look and feel to some of their long-range U.S. temperature and precipitation forecast maps on September 15, 2021. As part of the National Weather Service’s suite of official forecast products, these maps are widely used by weather forecasters, media outlets and decision-makers whose industries rely on accurate weather information.

Read More »
Figure: Collocated and globally averaged SST biases against Argo observations. A 15-day filter is applied to all curves for readability.

NOAA Daily Optimum Interpolation Sea Surface Temperature (DOISST) Version 2.1

ESSIC/CISESS Visiting Research Scientist Tom Smith is coauthor of an article on DOISST v.2.1 coming out in the September 2021 issue of the Journal of Climate. The paper, titled “Assessment and Intercomparison of NOAA Daily Optimum Interpolation Sea Surface Temperature (DOISST) Version 2.1”, shows how the improved NOAA operational analysis compares to several other available analyses.

Read More »
A visualization of the southern ocean

Faster Warming of the Slope Sea

Alexey Mishonov, ESSIC/CISESS Associate Research Scientist and NOAA Affiliate, has a new article in press and published in the journal Limnology and Oceanography titled “Recent Warming and Decadal Variability of Gulf of Maine and Slope Water”.

Read More »