Home » atmospheric measurement techniques

Tag: atmospheric measurement techniques

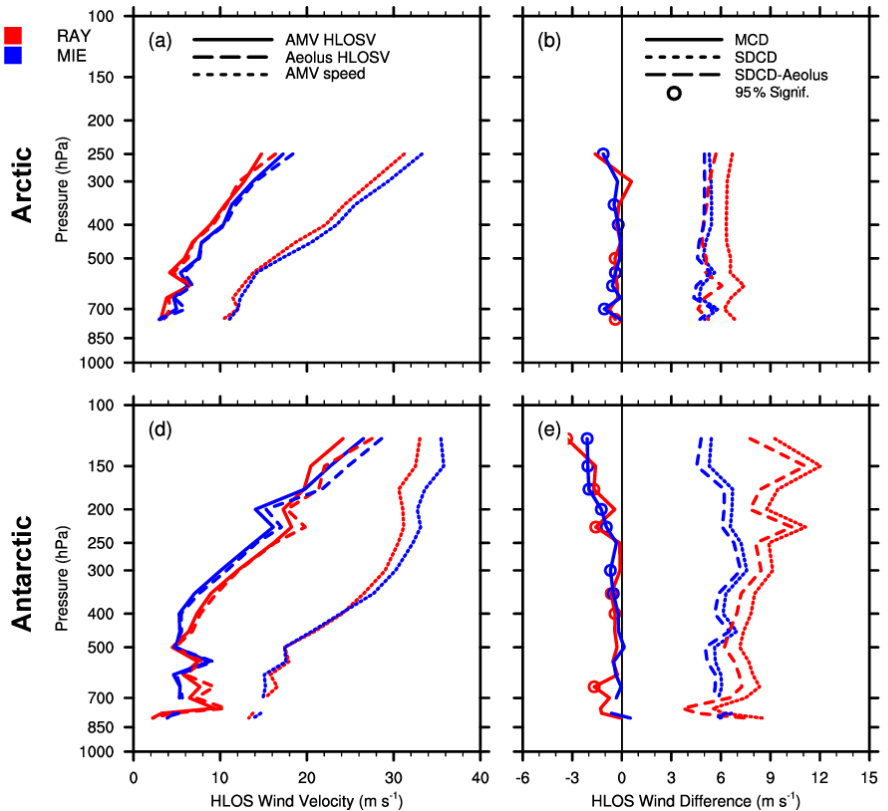
Figure: Vertical profiles of co-located LEO AMVs and RAY (red) and MIE (blue) winds. The top row shows the Arctic (north of 60° N), (a) mean AMV HLOSV (solid lines), Aeolus HLOSV (long dashed lines; m s−1), and mean AMV wind speed (short dashed lines; m s−1), (b) MCDs (solid), SDCDs (short dashed), and AMV HLOSV error, as represented by SDCD–Aeolus L2B uncertainty (long dashed; m s−1), and (c) co-location counts. Panels (d–f) are as in panels (a–c) but for the Antarctic (south of 60° S). Colored open circles indicate levels where MCDs are statistically significant at the 95 % level (p value < 0.05), using the paired Student’s t test. Vertical zero lines are displayed in the center panels in black. Levels with observation counts > 25 are plotted.

Atmospheric Motion Vector Bias and Uncertainty

ESSIC/CISESS Scientists Katherine Lukens (a former CISESS grad student), Kayo Ide, Hui Liu, and Ross Hoffman have a new article in the journal Atmospheric Measurement Techniques about their work with the NOAA/NESDIS Office of Projects, Planning, and Acquisition (OPPA) Technology Maturation Program (TMP). The need for highly accurate atmospheric wind observations is a high priority in the science community, particularly for numerical weather prediction (NWP). To address this need, this study leverages Aeolus wind lidar level-2B data provided by the European Space Agency (ESA) as a potential comparison standard to better characterize atmospheric motion vector (AMV) bias and uncertainty.

Read More »