Quingyuan Zhang on the VIIRS Flood Inundation Maps for the 2022 Red River Flood
Cazzy Medley
Highlights
ESSIC/CISESS Scientist Qingyuan Zhang has collaborated with NOAA’s Sean Helfrich (STAR/SMCD) to explore and document the Red River flood in 2022.
The Red River flows slowly northward from its source region in South Dakota/Minnesota to Canada. Daily mean temperatures in the Red River of the North throughout the winter and spring typically average 3°- 6°C cooler than those in the Red River of the South, remaining below freezing from late October to early April, then increasing to 7°- 8°C by the end of April/early May. The typical annual cycle in air temperature favors a South-to-North progression of the spring thaw, which is characterized by the melting of snow and river ice in the South during March while the downstream river channel remains frozen. These conditions favor flooding of the Red River and a backfill of the runoff into the river’s tributaries. Massive flooding typically is observed during heavy snow years in which the thaw is delayed.
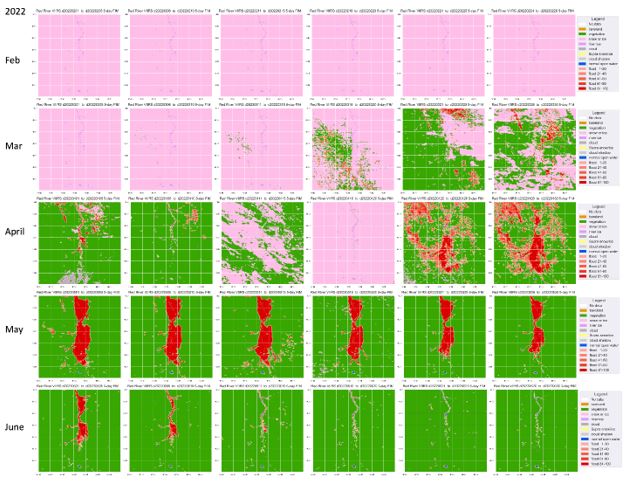
Figure: The Red River snow cover, river ice and flooding monitored with VIIRS 5-day Flood Inundation Maps (FIM) time series products from February through June in 2022.
Figure 1 reports the spatial and temporal dynamics of snow cover, river ice and flooding in the Red River from February through June in 2022 with VIIRS 5-day Flood Inundation Maps (FIM) products. The last heavy spring snow occurred during April 16 – 20. Massive flooding started to form in late April, stayed during May, and receded in early June.
Zhang had worked at GSFC/NASA for 14 years before he joined ESSIC.

")