Multivariate Non-Gaussian Data Assimilation for Multi-scale Weather Prediction
Cazzy Medley
Highlights
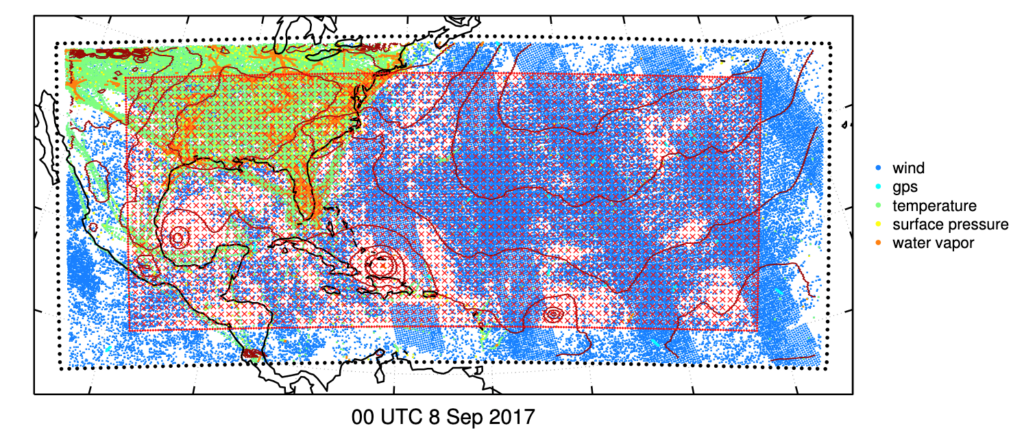
Figure: The dotted line indicates model domain boundaries used for this study, which are plotted alongside (solid black lines) land boundaries. For reference, (red lines) contours of modeled surface pressure are plotted every 5 hPa along with locations of measurements at a single time (00 UTC8 September 2017). The red hatched region indicates the domain over which verifications were performed.
ESSIC/CISESS Scientist and Department of Atmospheric and Oceanic Science Professor Dr. Jonathan Poterjoy has recently examined the fidelity of error assumptions made by regional weather prediction systems using a novel technique that avoids common approximations.
This study used a month-long period and extensive forecast region that captured numerous high-impact tropical cyclones from the 2017 hurricane season, including Hurricanes Harvey and Maria. Findings reveal practical and measured improvements in operational prediction that can be achieved by simply adopting a more sophisticated specification of uncertainty than is currently used at environmental prediction centers worldwide.
The findings of this study motivate further research on new methods of performing “data assimilation” for atmospheric models, which is the process of using incomplete and error-prone environmental measurements to provide a holistic picture of natural systems. In this study, numerical predictions of Earth’s atmosphere are used to represent known physical processes governing the evolution of atmospheric flow, clever statistical methods to construct a complete model-representation of the true atmosphere from incomplete measurements along with assumptions of the shape of error distributions for variables that are input into models for generating predictions. This undertaking was further complicated by the need to consider how an error in one variable (e.g., temperature in Washington DC) is related to all other variables that characterize Earth’s atmosphere (e.g., wind, moisture, and pressure across the planet).

")