Monitoring Nighttime Light Changes with NASA’s Black Marble
Cazzy Medley
Highlights
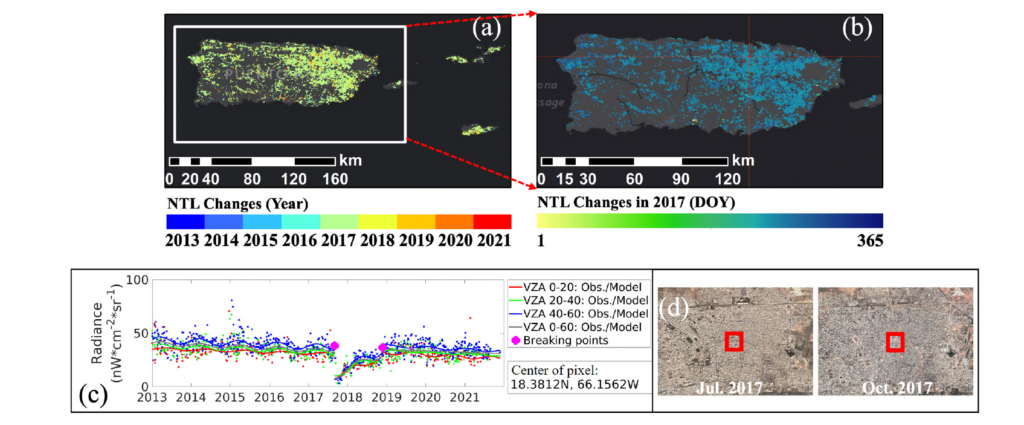
Fig. 12. The VZA-COLD detection results of a selected pixel, and high resolution images for Puerto Rico. (a) The accumulated annual NTL change maps from 2013 to 2021 with the latest detected change year presented. (b) The day-of day NTL change map in 2017 over the region enlarged from the white rectangle from Fig. 12a. (c) The time series plot of a selected pixel (red cross in Fig 12b) and the corresponding VZA COLD detection results, in which the red, green, blue, and grey colors indicate the different VZA intervals, the line represent the estimated models, the small dots are the DNB observations, and the large magenta dots are the detected changes. (d) The high-resolution Google Earth image in July 2017 and October 2017. The red squares represet the location and the size of the selected pixel in Fig 12c. The grey background in Figs.12a-b is the Esri ArcMap Dark Grey Canvas base map. (For interpretation of the references to colour in this figure legend, the reader is referred to the web version of this article.)
ESSIC Scientist Zhuosen Wang has a new paper in Remote Sensing of Environment that proposes the use of NASA’s Black Marble products to monitor nighttime light changes.
Nighttime light (NTL) tells us a lot about the dynamic patterns of human activity and socioeconomic features. NASA’s Visible Infrared Imaging Radiometer Suite (VIIRS) Day/Night Band (DNB) atmospheric- and Lunar-BRDF-corrected Black Marble product (VNP46A2) provides daily global nighttime radiances with high temporal consistency. However, timely and continuous monitoring of night time light changes based on the dense daily DNB time series is still lacking. In the study, Wang and colleagues propose a novel Viewing Zenith Angle (VZA) stratified COntinuous monitoring of Land Disturbance (COLD) algorithm (VZA-COLD) to detect NTL change at 15 arc-second spatial resolution with daily updating capability based on NASA’s Black Marble products. The NTL change product (VNP46A5) based on this algorithm is expected to be released to the public from early next year.
Wang is an Associate Research Scientist with research interests in monitoring human activities using Suomi-NPP and NOAA-20 VIIRS Day/Night Band nighttime light observations; modeling and evaluation of land surface anisotropic characteristics and albedo; and canopy structure estimation using optical remote sensing and Lidar. He is the principal investigator of NASA’s Black Marble nighttime product suite.

")