Mishonov Studies Nepheloid Layers in the Gulf of Mexico
Cazzy Medley
Highlights
Alexey Mishonov, ESSIC/CISESS Associate Research Scientist and NOAA Affiliate, has a new article in Marine Geology about the nepheloid layers in the deep Gulf of Mexico with colleagues from Texas and Mexico.
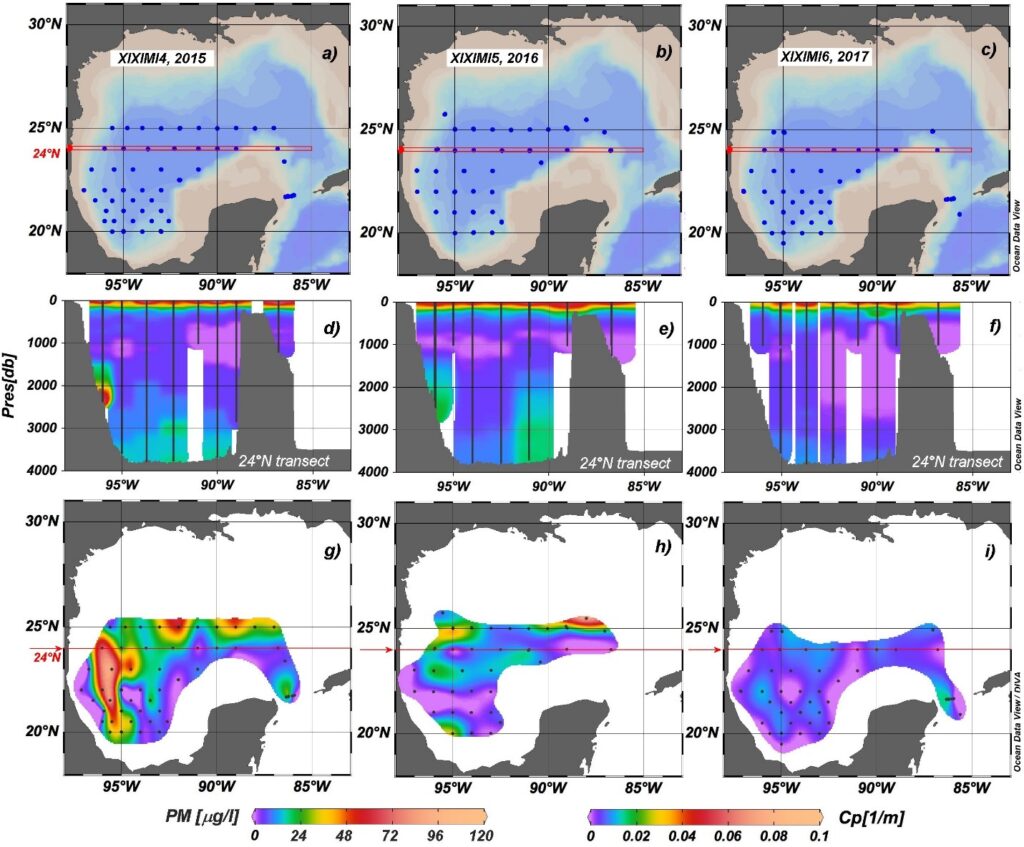
Nepheloid layers are layers of water above the ocean floor that contain significant amounts of suspended sediment. In the paper, Mishonov and his team analyzed the first measurements of bottom nepheloid layers in the central and southern deep waters of the Gulf of Mexico west of the Yucatan peninsula made in 2015-2017. They estimated particulate matter concentrates and found evidence of sediment resuspension, possibly linked with topographic Rossby waves, loop current eddies, or eddy-topography interactions.
The researchers also made comparisons between areas with benthic nepheloid layers and Eddy Kinetic Energy (EKE) patterns in the deep Gulf of Mexico. They found that regions of high EKE or strong bottom currents in the central and eastern Gulf were detected over a large region of deeply eroded furrows in the seafloor previously imaged using 3-D seismic profiling and submersible observations. Few particulate matter measurements were obtained in these high EKE areas, however, historical and recent sampling show very strong nepheloid layers at stations within and westward of the region of the actively eroding furrows.
Mishonov is a researcher with extensive experience in various fields of oceanography, including ocean color, water transmissivity and particulate organic carbon study, oceanographic data management, analysis, and climate research.
Figure: a-c) Station maps of cp profiles during XIXIMI 4–6 cruises; d-f) vertical sections of cp (m 1) at stations between red lines in a-c) along 24◦N in 2015–2017; g-i) maps of bottom cp in 2015–2017. Arrows and red lines in g-i indicate the line of stations used for sections shown in d-f. Bold vertical lines in the sections (d-f) indicate the location of profiles. The outer edge of light blue shading on the station maps (a-c) denotes 1000 m depth.
")


