")
Global Precipitation—2017 Anomalies, La Nina, Trends
By: Robert Adler

Written by: Robert Adler, Guojun Gu, and Jian-Jian Wang
ESSIC scientists are involved in monitoring and analyzing precipitation across the entire globe, including using both satellite and conventional surface measurements to provide an integrated monthly analysis as part of an international effort called the Global Precipitation Climatology Project (GPCP). This effort is important to understand the climatology and variations of precipitation both regionally and globally and to track changes related to phenomena such as the El Nino Southern Oscillation (ENSO) and changes related to global warming. Here at the beginning of the new year a summary of what happened during last year (2017) is compiled and compared to the GPCP length of record going back to 1979. The headlines coming out of this climate monitoring activity are:
1) La Nina effects continue into 2017 for global totals and pattern
2) Positive global mean precipitation trend becoming evident with GPCP
3) Global land precipitation at or near all-time high in 2017
4) 2017 contributes to ongoing trends in precipitation intensity in the tropics
Fig. 1 shows the GPCP climatology map (1979-2016), the annual mean map for 2017, and anomaly maps for 2017, for both rain rate magnitudes and percentages. The climatology map shows the usual maxima of the tropics and mid-latitudes, with similar features, of course, for 2017. The annual anomaly maps (Fig. 1c and 1d) emphasize those features, showing a definite La Nina pattern with the strong positive anomaly over the western Pacific and a rainfall deficit over the central and eastern Pacific near the Equator, indicating the importance of the El Nino Southern Oscillation (ENSO) in shaping rainfall patterns across the globe. Typical La Nina anomaly features can also be seen in some other locations such as the tropical Atlantic, the negative anomaly off of Baja Mexico extending into the southwest corner of the U.S., and a typical La Nina pattern along the east coast of Africa. At higher latitudes, for example across northern Eurasia and Alaska, positive anomalies dominate the inter-annual changes, but also may be related to an estimated positive trend over the GPCP record in these areas.
The globally integrated number for the planet for 2017 is 2.72 mm/d, about 1% higher than the mean for the entire GPCP record. To put the global number for 2017 in context, Fig. 2a shows plots of the annual anomaly of the global total (and ocean and land totals) from 1979-2017, with Fig. 2c showing annual mean values for Nino 3.4 as a measure of ENSO for comparison with the annual anomaly values. The ocean and land values in Fig. 2a “flip-flop” between El Nino and La Nina years, with the global total value having smaller year-to-year variations, although larger during El Nino years (e.g., 1998, 2010, 2015-2016). 2017, a weak La Nina year, has an estimated record-setting high GPCP land value, compensated by a relatively low ocean value. The global value for 2017 is not a record high value, although the combination of 2016 and 2017 has an estimated mean that is higher than any other sequential two-year mean. The estimated trend is calculated for the three curves in Fig. 2a and is a very slight positive for all three, with a value of 0.009 mm day-1 decade-1 (0.33 % per decade) for the global trend (significant at the 5% level). The second panel (Fig. 2c) removes the ENSO effect on the annual anomalies, and results in reduced variations, but the trend values stay the same and the significance results are also unchanged relative to the 5% threshold. The small calculated global precipitation trend compared to the global surface temperature trend (0.16 K decade-1) for the same period gives a 1.3% K-1 for the rate of increase in global precipitation in relation to global warming. This value is close to the value often quoted coming from climate models, but the GPCP-based value is very sensitive to the length of the record.
Although the global trends in Fig. 2 are very small, the trends from 1979 to 2017 are larger and variable in the spatial domain (see Fig. 3), with the pattern showing an area of positive trend along most of the ITCZ, especially across the Pacific and Indian Oceans. Oceanic decreases north and south of the Pacific ITCZ are adjacent and weakly connected to decreases over land, as in the southwestern U.S. A general scenario of wet areas getting wetter, dry areas getting drier is evident. At high northern latitudes the positive trends noted across Eurasia and the Arctic Ocean to Alaska are similar to the positive anomaly features seen in Fig. 1 for 2017.
Data from 2017 have also been incorporated into an on-going investigation of trends in rainfall intensity using the monthly GPCP analyses. Focusing on the tropics and the post-1987 period (the satellite microwave era) percentiles (and other parameters related to intensity) at each grid were derived and compared to the previous years (see Fig. 4). The mean tropical rainfall has a positive trend over the period (Fig. 4d), but it is also evident that there are even stronger positive trends in the higher percentiles (more intense rainfall), with significant trends at percentiles greater than 70% (see Fig. 4a). At intermediate percentiles (30-40%) a downward trend is noted (Fig. 4c). At low percentiles (not shown) trends were indeterminate, but defined “dry areas” showed increases during the period.
Continued production and improvement of observation-based analyses like GPCP are critical to understand our changing climate and its related water cycle, including the key component of precipitation.
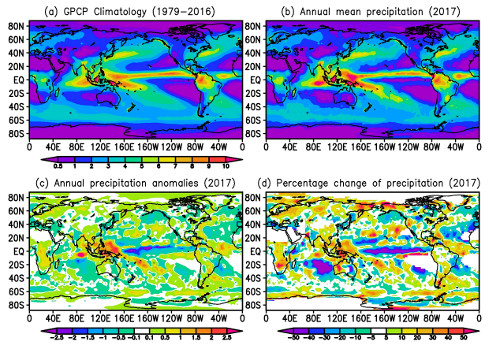
Figure 1. (a) GPCP climatological mean precipitation (mm day-1), (b) annual mean precipitation in 2017, (c) annual precipitation anomalies (mm day-1) in 2017, and (d) annual precipitation anomalies in percentages for 2017 (with areas having less than 0.5 mm day-1 of mean precipitation also shown in white).
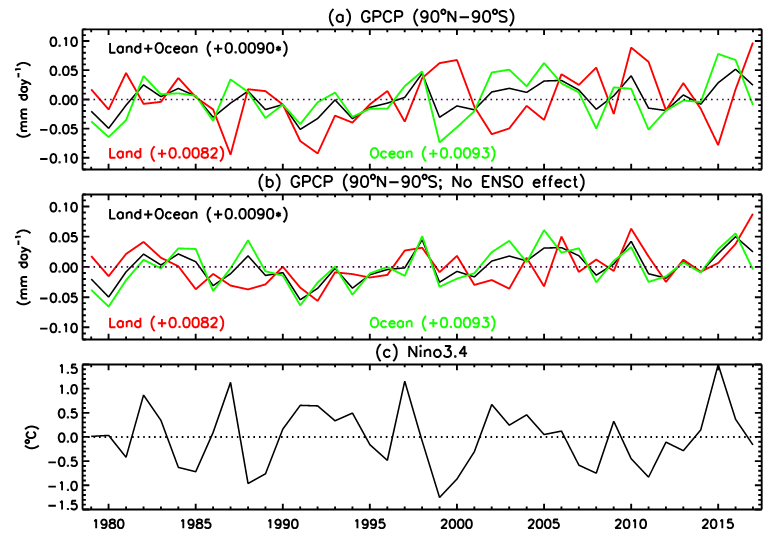
Figure 2. Time series of (a) global, annual mean precipitation anomalies, (b) no ENSO effect, and (c) annual mean Nino 3.4. Also shown in (a) and (b) are corresponding linear trends (mm day-1 per decade), and those followed by “*” are statistically significant.
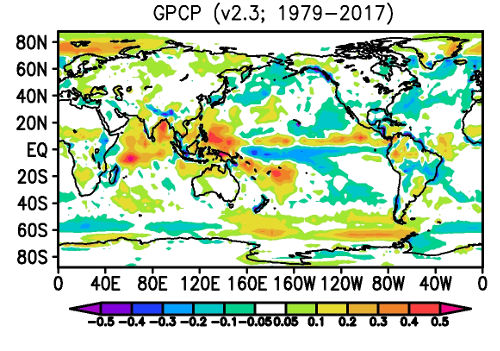
Figure 3. Linear trend of GPCP precipitation (mm day-1 per decade) during 1979-2017.

Figure 4. Annual anomalies of (a, b, c) precipitation percentiles and (d) mean precipitation determined by GPCP monthly rain-rates between 30oN-30oS (land+ocean). Also shown are their corresponding linear trends (mm day-1 per decade), and those followed by “*” are statistically significant.