")
Review of Global Precipitation for 2022
Robert Adler and Guojun Gu
University of Maryland
January 9, 2023
Headlines:
1) La Nina conditions dominate 2022, especially evident in tropics with excess rainfall and flooding over the Maritime Continent and northern South America and also evident in global totals.
2) The continuing La Nina (started in 2020 Boreal Spring) has significant effects on water resources, e.g., drought in southern/central U.S., eastern Africa and even western Europe.
3) Tropical to mid-latitude gradient of precipitation continues to increase with above average value in 2022, a clear indication of wet getting wetter and dry getting drier.
The continuing La Nina dominates the spatial distribution of precipitation across the globe for 2022 and even the global total for the year in a very similar fashion to the previous year, 2021. This current La Nina started in the Boreal Spring of 2020 and, although there have been variations in intensity (as indicated by values of the Nino 3.4 index) the annual precipitation anomaly patterns have been generally consistent with each other for 2021 and 2022. This consistency has practical considerations in terms of distribution across the globe of floods and landslides on the wet side and drought on the dry side of things.
The annual mean precipitation map for 2022 (Fig. 1, top panel) shows the usual precipitation maxima of the tropics and mid-latitudes and dry zones in the sub-tropics and, of course, generally looks very similar to the long-term climatology (not shown). However, there are significant anomalies for 2022 from that long-term (1979-2021) climatology as seen in the middle panel of Fig. 1. The most intense rainfall anomaly features are the positive and negative areas in the deep tropics along the Equator at the core of La Nina impact in the central Pacific (negative anomaly) and to the west over the Maritime Continent and border between the Pacific and Indian Oceans (positive anomaly). The maximum deviations at the core of these features are greater than +/- 3 mm/d. With La Nina’s associated below normal SSTs in the central Pacific Ocean, convection and rainfall are suppressed there. With the east-west oriented Walker circulation shifting longitudinally, enhanced rising motion is centered to the west to go along with the relative descent over the central Pacific negative rainfall anomaly. This relatively subtle change happens, even though the Inter-Tropical Convergence Zone (ITCZ) still maintains its narrow east-west intense rainfall mean structure across the Pacific along with the broader north-south feature to the west associated with the Asian-Australian monsoon system. Further east positive anomalies dominate the northern part of South America and the Atlantic ITCZ. These features are typical of La Nina conditions in general. This is confirmed by the La Nina composite (Fig. 1, bottom panel) constructed by taking the mean of annual precipitation anomaly fields for the years where the annual mean Nino 3.4 SST index is in the one-third lowest (coolest) part of the range of SST values. For 2022 the Nino 3.4 mean index value is -0.94.
These tropical La Nina features in 2022 helped to fuel frequent flood and landslide conditions, for example, in Indonesia and Malaysia, Indochina, southern India, Pakistan and the southeast quadrant of Australia. Floods and landslides were also more prevalent across northern South America and eastern Brazil related to the typical La Nina features there, but with dry anomalies and drought conditions existing over much of the southern half of South America.
There is an obvious correlation in the pattern of anomaly features for 2022 and those in the composite (which does not include 2022). For example, the spatial correlation between panels b and c of Fig.1 between 40ºN and 40ºS is +0.72. This spatial agreement can even be seen to extend into the mid-latitude parts of the Pacific Ocean in both hemispheres. Stretching southeastward from the anomaly couplet in the tropical western Pacific, anomaly features extend to 60ºS with the dry zone reaching the southern tip of South America, with the adjacent positive anomaly reaching the Straits of Magellan. These features showing up in both in 2022 and the composite anomaly fields indicates the long-distance influence of the central Pacific Ocean SST conditions.
The Indian Ocean also reflects the La Nina effect with positive anomalies in the east and dry conditions in the west, extending over the Horn of Africa and southward through eastern Africa, but with positive anomalies over South Africa. The dry features over Somalia and southward have led to a multi-year severe drought in these areas and even power cuts in Zambia due to low water in power-generating dams. In the La Nina composite Australia is covered with above average precipitation, but the corresponding feature for 2022 only covers most of the country, but is reflective of prevalence of floods in the southeast.
Over North America the La Nina composite has a dry feature over the eastern Pacific extending across all the southern U.S. states with a positive anomaly across Canada; however, although the pattern for 2022 has a corresponding feature in the eastern Pacific, over the continent things are somewhat different, with drier than normal conditions over most of the central and eastern part of the continent, even associated with low flow in the Mississippi River, but varied conditions to the north, with wetter than normal conditions in Alaska. For 2022 the general ongoing drought in the western part of the U.S. was weakened in some areas in opposition to the usual effect of La Nina. The Hawaiian Islands have also experienced weak drought conditions in 2022 and that agrees with the anomaly pattern for the 2022, which might have some association with La Nina, although in that part of the Pacific the La Nina composite is spatially very variable. The 2022 pattern across the Caribbean and tropical Atlantic north of the ITCZ also is not typical of La Nina, which usually is associated with increased hurricane activity, but remained relatively dry this year.
To the east of North America, the Atlantic Ocean is covered with a large area of below average precipitation for the year, roughly in agreement with the La Nina composite. That negative feature for 2022 extends into western Europe and is associated with the major drought ongoing over that area. Although the composite is relatively weak there, it still seems to be of the same sign as this year’s precipitation deficit and may indicate a distant extent of La Nina’s effect.
Fig. 2 shows the anomaly patterns for the three-month intervals during 2022 having a high degree of consistency during the year, especially across the tropical Pacific belt and beyond to the east and west. Variations during the year are noted in the intense positive anomaly for the summer in southern Pakistan and India, the strong dry anomaly over the Horn of Africa during its rainy season in Spring and a wet/dry variation over South China during the year.
The estimated mean global precipitation for 2022 is estimated from the GPCP Monthly analyses as 2.67 mm/d, just below (-.02 mm/d) the 40-year climatological mean of 2.69. The mean values for ocean and land are 2.85 (-.05) and 2.30 (+.05) mm/d, respectively. This kind of distribution with the positive anomaly over land and negative anomaly over ocean is typical of La Nina. The global total (land plus ocean) being slightly below average is also typical of La Nina conditions and reflects the slightly reduced ocean temperatures affecting ocean evaporation. More detail on trends in global and regional precipitation and comparison climate models is available in Gu and Adler (2022).
One key large-scale planetary trend that is extended with the 2022 data is the deep tropics (0-10°N, land plus ocean) increasing and sub-tropics (30-40°N, land plus ocean) decreasing (Fig. 3). This is a definite indication of wet-getting-wetter and dry-getting drier climate change at a large scale as the mean values in these two bands are different by a about a factor of two, with the larger value at the lower latitude. The year 2022 contributes to this trend, but is not the maximum value in the difference or gradient calculation (4th biggest of the entire period). The La Nina years (e.g., 2021, 2022) tend to have smaller deep tropic numbers, for example, compared to 2015, dominated by El Nino conditions.
This annual distribution of global precipitation is analyzed using the Global Precipitation Climatology Project (GPCP) monthly data set (Version 2.3), which is a long-term (1979-2022) analysis (Adler et al., 2017, 2018) using a combination of satellite and gauge information. An interim GPCP analysis completed within 10 days of the end of the month allows for use in climate monitoring and, in this case, an examination of the just completed year.
References
Adler, R., G. Gu, M. Sapiano, J. Wang, G. Huffman 2017. Global Precipitation: Means, Variations and Trends During the Satellite Era (1979-2014). Surveys in Geophysics 38: 679-699, doi:10.1007/s10712-017-9416-4
Adler, R., M. Sapiano, G. Huffman, J. Wang, G. Gu, D. Bolvin, L. Chiu, U. Schneider, A. Becker, E. Nelkin, P. Xie, R. Ferraro, D. Shin, 2018. The Global Precipitation Climatology Project (GPCP) Monthly Analysis (New Version 2.3) and a Review of 2017 Global Precipitation. Atmosphere. 9(4), 138; doi:10.3390/atmos9040138
Gu, G., and R. Adler, 2022. Observed Variability and Trends in Global Precipitation During 1979-2020. Climate Dynamics, https://doi.org/10.1007/s00382-022-06567-9
Figures
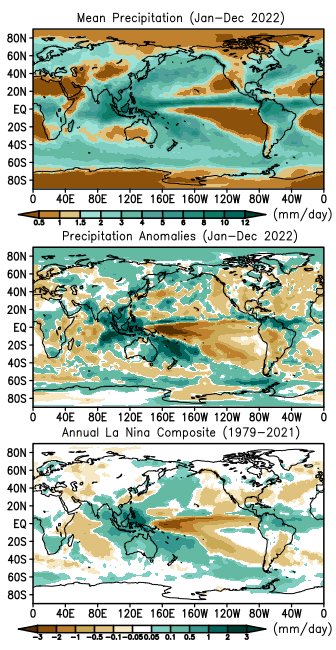
Figure 1. Mean precipitation and annual precipitation anomalies in 2022, and annual La Nina composite during 1979-2021. Spatial correlation between annual precipitation anomalies and La Nina composite (area-weighted) is (+0.72) between 40oN-40oS. The mean Nino3.4 is -0.94 in 2022.
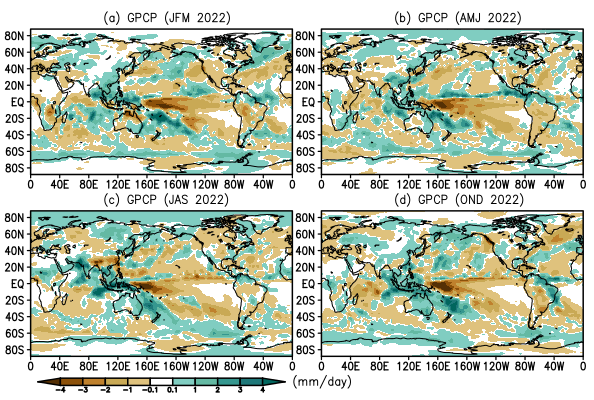
Figure 2. Three-month mean precipitation anomalies in 2022.
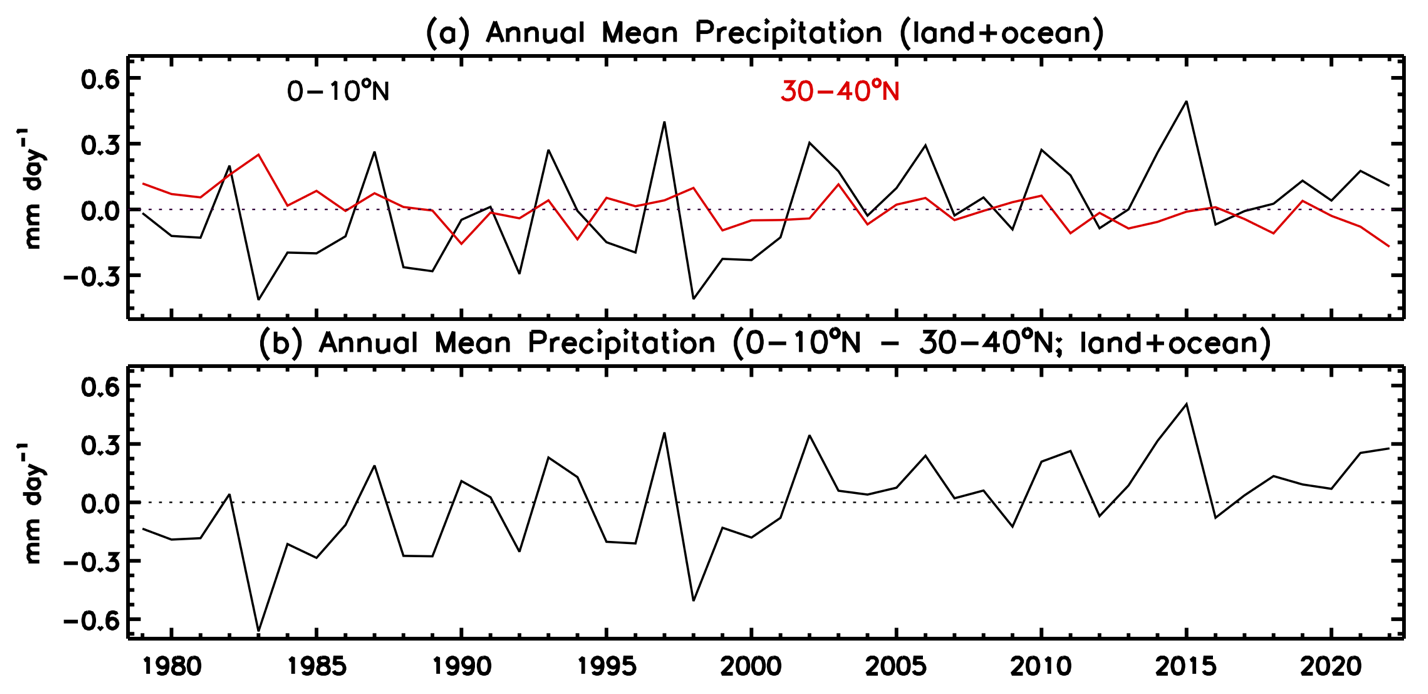
Figure 3 (a) Time series of annual mean precipitation anomalies within two latitude bands over land+ocean: 0-10oN and 30-40oN. (b) The differences between the two bands.
