")
Complex Interactions between Wildfires and Lightning during Summer 2012
By: Scott Rudlosky
Contributions from Wilfrid Schroeder (CICS-MD) and Janice Coen (NCAR)
Complex interactions between lightning and wildfires were on full display during summer 2012. Record heat and drought gave rise to massive wildfires and an extremely active wildfire season in the western United States. Over 8 million acres burned nationwide during June (1.36 million), July (2.01 million), August (3.64 million), and September (1.08 million), which is the second most acres burned since 2000. Despite the vast acreage burned, August and September actually had their second fewest fires on record. This tendency for fewer, but larger wildfires raises many questions for scientists and wildfire suppression personnel. An important distinction between anthropogenic and natural wildfires may contribute to this observation. On average, humans (anthropogenic) start more wildfires than lightning (natural), but lightning-ignited fires burn more area. For example, lightning ignited roughly half of all Montana wildfires this summer, but these fires charred over 90% of the total acres burned. Since lightning often ignites wildfires in remote regions, these fires are particularly difficult to suppress.
Both space- and ground-based sensors provide crucial information to decision makers during wildfire events. Satellites provide detailed observations of active wildfire locations, and the launch of the Suomi NPP satellite during October 2011 further enhanced these space-based wildfire detection and mapping capabilities. Observations of cloud-to-ground (CG) lightning flashes are provided by the National Lightning Detection Network (NLDN), which reports the polarity and estimated peak current for more than 90% of all CG flashes in the U.S. The two main types of CG flashes are negative (–CG) and positive (+CG). Although most CG flashes transfer negative charge to ground (i.e., –CG), +CG flashes often exhibit a unique combination of high peak current and long continuing current, making them prime candidates for igniting wildfires. Remarkably, studies have shown that storms that ingest smoke from wildfires during drought conditions can produce predominately +CG flashes, potentially igniting a disproportionate number of wildfires.
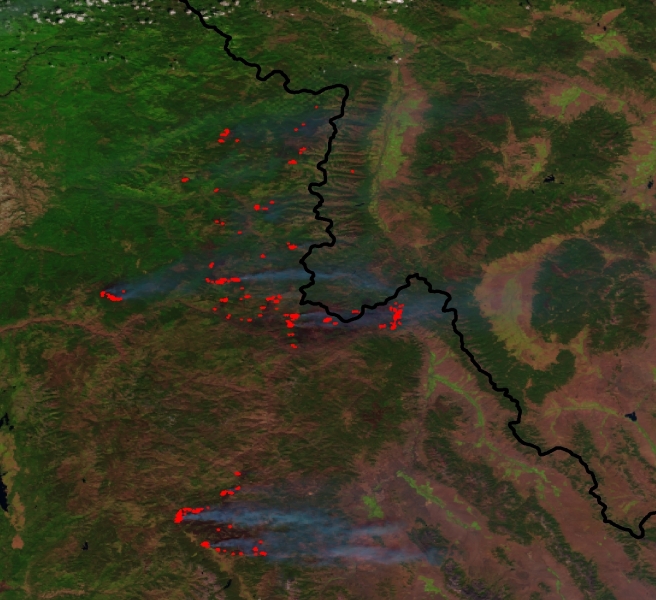
Lightning ignited the Rush Fire in Northern California around 7:00 pm on August 12. Gusty winds rapidly spread the fire through dry vegetation, eventually burning over 315,500 acres as California’s second largest wildfire since 1932. Two very strong +CG flashes struck at 6:59 pm (80 kA) and 7:03 pm (74.3 kA), which matches well with the official start time estimate (approx. 6:42 PM). The animations below overlay +CG and –CG flash locations onto “true” color images and active fire detections (red) from the Suomi NPP satellite (http://viirsfire.geog.umd.edu). The first animation shows that the Reading (28,079 acres) and Chips (75,431 acres) fires (lower left) were producing large quantities of smoke when strong +CG flashes ignited the Rush Fire. Note the rapid fire progression and the contrast between the burn scar and surrounding terrain following containment on August 30. Be sure to select HD quality if your internet connection permits.
In the animations below, each frame corresponds to one day, red areas indicate active fire locations, the black and white plus (minus) signs are the daily +CG (-CG) flashes, and the yellow symbols are the flashes that started the main fires.
The High Park Fire was ignited by a lightning strike in early June west of Fort Collins, Colorado, “quickly” becoming the second largest wildfire in Colorado history (87,284 acres). Although officials estimated that the fire started on June 9, the animation below shows that the lightning actually occurred on June 7 (first frame). This indicates that despite the dry vegetation the fire must have smoldered until conditions became more favorable for rapid growth on June 9. Scientists at the National Center for Atmospheric Research (NCAR) have created fascinating high-resolution simulations of the High Park Fire (see below, NCAR page). Their simulation reveals the significant influence of complex terrain and strong winds on wildfire progression. These scientists are now working to incorporate lightning information to more accurately define the fire ignition source in both space and time. These collaborative research efforts will continue to improve our understanding of interactions between lightning, wildfires, and environmental conditions.
The Mustang Fire Complex consisted of five lightning-ignited fires along the Idaho/Montana border that started during late July and early-August. These fires were concentrated in beetle-killed lodgepole pine forests of Idaho, illustrating an important ecological influence. The animation below shows a predominance of +CG flashes on several days, and reveals that many of the fires smoldered before growing simultaneously as conditions “improved”. The terrain and remarkable spread of these fires posed significant challenges for firefighters, and the estimated suppression costs for the Mustang Complex (center) and Halstead Fire (bottom) incidents exceeded $36 million and $26 million U.S. dollars, respectively. In Montana, the Elbow Pass Complex (26,128 acres, top right in the final frames) continued burning until the area received between 2.5 inches and 12 inches of snow on October 3 (not shown).
The final animation documents the rapid growth of the Ash Creek (center), Reno Creek (furthest west), Sarpy Complex (east of Reno), and Rosebud Complex (furthest north) in southeastern Montana (23 June through 13 August). The Ash Creek Complex (249,562 acres) was the largest U.S. fire during June, and the Rosebud Complex charred an additional 171,444 acres during August. This final example further illustrates the tremendous challenges faced by wildfire managers during this exceptionally active wildfire season.
This article was motivated by ongoing collaborations between the National Oceanic and Atmospheric Administration (NOAA), Cooperative Institute for Climate and Satellites (CICS), University of Maryland (UMD), and National Center for Atmospheric Research (NCAR). This collaborative research is expanding as part of the Joint Polar Satellite System (JPSS) and Geostationary Operational Environmental Satellite – R Series (GOES-R) Proving Ground efforts, which aim to demonstrate future operational capabilities using existing technologies. A team of NOAA/CICS/UMD scientists have developed proving ground demonstration products, and created websites to share these products with wildfire
managers. The main website describes the project and provides access to archived imagery (http://viirsfire.geog.umd.edu), and a second website provides more information in a Google Maps format (http://blaze.umd.edu/map). This collaborative research will continue to develop new tools and techniques, and will fine tune methods for sharing these valuable assets with decision makers.
The links below provide additional information on the fires and science discussed in this article. Please feel free to post any comments or questions you may have below.
National Climate Data Center (NCDC) Monthly State of the Climate – Wildfires
Colorado Wildfires as viewed from the International Space Station