")
Task 235
Arctic and Southern Ocean Sea Ice
Principal Investigator(s):
S.L. Farrell
Sponsor(s):
T. Markus
Last Updated:
October 26, 2012 15:26:01
Description of Problem
The work being conducted under this project is in support of NASA’s Ice, Cloud, and land Elevation Satellite-2 (ICESat-2) scheduled for launch in 2016. ICESat-2 is a follow-on to the ICESat mission, which operated between 2003 and 2009. ICESat-2 will provide sustained monitoring of changes in ice-sheet mass balance, and Arctic and Southern Ocean sea ice volume. The goals under this ICESat-2 Science Definition Team (SDT) project are to derive the Level 1 and 2 sea ice science requirements and measurement accuracies, and to determine the optimum strategy for sampling the complex sea ice environment of the Arctic and Southern Oceans.
Scientific Objectives and Approach
We aim to define the optimal footprint size, spacing, and ground-track configuration, for sea ice observations using satellite laser altimetry. The system is required to obtain representative elevation measurements over sea ice, and identify leads within the ice pack, so as to provide accurate measurements of sea surface height, sea ice freeboard, and ultimately sea ice thickness. The technical approach is to use airborne laser altimetry data to simulate ICESat-2-type data prior to launch. Analysis of airborne data gathered over Arctic sea ice is used to perform a trade study for the various multi-beam systems being considered for the ICESat-2 mission, as well as identify possible sources of geophysical range error.
Accomplishments
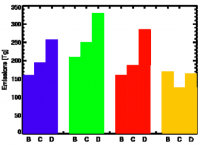
We have conducted an analysis of a variety of sampling strategies for the ICESat-2 mission over sea ice. Using data gathered by the Airborne Topographic Mapper (ATM) laser altimetry system, we simulated two high-resolution surface elevation models typical of first-year and multi-year sea ice environments (e.g. black curve, Figure 1, top panel). To investigate differences in measurements gathered at varying spatial resolutions and the impact on sea-ice freeboard, the model surfaces were sampled using four measurement patterns employed in laser altimetry. The four simulations included an ICESat pattern (50 m footprints with 170 m along-track spacing), a Land Vegetation and Ice Sensor (“LVIS”) pattern (20 m contiguous footprints), an ATM pattern (2 m footprints in a conical scanning mode), and a dense photon-counting pattern (10 m footprints with 1 m spacing). We assessed the ability of each system to reproduce the elevation distributions, mean freeboard, lead and ridge height of the two sea ice models. Accurate identification of leads is critical for precise estimation of sea ice freeboard and thickness.
Overall the analogue laser systems performed well, reproducing mean freeboard height in 25 km segments in both first-year and multi-year sea ice regimes to cm-level accuracy or better. However both LVIS and ICESat underestimated surface roughness, ridge fraction and elevation, due to averaging of elevations within their 25 or 50m footprints (Figure 1, center panel). The ATM system performed better, accurately reproducing all characteristics of the sea ice surface as prescribed in the models (Figure 1, center panel).
The simulation of the digital photon-counting approach proposed for the ICESat-2 system, resulted in freeboard heights that were biased high compared to the expected solution (grey dots, Figure 1, bottom panel). However, the ICESat-2 simulation yielded accurate statistics on floe elevation, and ridge fraction and height, compared to the model data, performing better than ICESat and LVIS. The probability of detecting photons reflected from high-albedo surfaces (e.g. snow) is higher than the probability of detecting photons reflected by dark surface (e.g. leads). This concept may explain part of the mean elevation bias. An along-track averaging approach was found to mitigate the problem, reducing the elevation bias to within a few centimeters (dark blue line, Figure 1, bottom panel).
We found that the dense along- and across-track sampling of the ATM and ICESat-2 instruments was best suited for identifying leads within the ice pack and accurately reproduced sea surface elevation and open-water fractions that were consistent with the model data. ICESat-2 offers some considerable improvements compared to its predecessor ICESat: in particular, its dense along-track sampling of the surface will allow flexibility in the post-processing algorithmic approaches taken to optimize the signal-to-noise ratio and obtain accurate and precise freeboard retrieval. In this regard, the photon-counting approach represents an excellent option for space- based satellite laser altimetry of the sea-ice pack.
The primary instrument to be carried on ICESat-2, the Advanced Topographic Laser Altimeter System (ATLAS), is a photon counting system operating in the visible light range (532 nm). Future work under this project will involve an investigation into the penetration of the 532 nm (green) laser beam into (1) open water and (2) the snow pack, which could result in altimetric range errors. We will quantify the magnitude of these potential geophysical range errors, and if required, derive a methodology for bias-correction of the laser data.
The extent of penetration of visible-wavelength laser light into open water will be investigated using data from two airborne systems. Elevation data from the ATM system will be used to examine forward scattering versus penetration of the laser beam into water column using two measurement scan-angles. Elevations derived from a wider 20o scan-angle will be compared to coincident data collected using a narrower 5o scan-angle over Antarctic sea ice. In addition, data collected over open-ocean during a recent airborne campaign carrying the Multiple Altimeter Beam Experimental Lidar (MABEL) system, the ICESat-2 simulator, we be used to better quantify the extent of these scattering issues.
In collaboration with colleagues at the University of Washington, Seattle, the extent of surface versus volume scattering of the green laser beam in snow will be investigated though the use of model simulations. A photon counting model simulates the ICESat-2 geometry and detector design and is used to better understand the expected distribution of photons in range that will be observed at our detector given different snow cover characteristics. We will use the simulations to determine the expected biases associated with photons from the subsurface given variable snow depth, density and snow grain size.
Initial project results were reported via presentations at ICESat-2 science team meetings and at the American Geophysical Union Fall Meeting (December 2009). Scientific results of the first phase of this study have been published in the International Glaciological Society (IGS) Annals of Glaciology [Farrell et al., 2011].
Refereed Journal Publications
Farrell, S. L., T. Markus, R. Kwok, L. Connor, 2011: Laser altimetry sampling strategies over sea ice. Annals of Glaciology, 52 (57), 69- 76.
Other Publications and Conferences
Farrell, S. L., T. Markus, L. Connor, J. Miller, 2009: Laser Altimetry Sampling Strategies over Sea Ice. Eos Trans. AGU, 90(52), Fall Meet. Suppl., Abstract C41D-05, American Geophysical Union Fall Meeting, San Francisco.
Farrell, S. L., T. Markus, L. Connor, J. Miller, 2009: ICESat-2 Measurement Scenario Simu
lations over Sea Ice: an update. ICESat-2 Science Definition Team (SDT) Meeting, NASA Goddard Space Flight Center, Greenbelt, Maryland, October 6-7, 2009.
Farrell, S. L., T. Markus, L. Connor, J. Miller, 2009: ICESat-2 Measurement Scenario Simulations over Sea Ice. ICESat-2 Science Definition Team (SDT) Meeting, CIRES, University of Colorado, Boulder, Colorado, April 8-9, 2009.


