")
Task 206 and 254
Vegetation 3D structural parameters from multi-sensor data: Biomass mapping and change analyses from LVIS data
Principal Investigator(s):
G. Sun
Sponsor(s):
K. J. Ranson
Last Updated:
October 26, 2012 15:25:46
Description of Problem
Lidar provides sample data for forest parameters mapping using other imagery data in a region. Most of previous studies on biomass estimation from lidar data produced satisfactory results at forest stand or plot levels, not in the lidar footprint level. To map biomass using remote sensing imagery data in large scale, the estimation of biomass at lidar waveform footprint needs to be investigated.
Scientific Objectives and Approach
The models developed using field measurements at footprints were applied to all LVIS waveforms within the study sites. Plots at 0.25-ha, 0.5-ha and 1-ha were used to validate the biomass averaged from footprints measured in these plots. The effect of forest disturbances on lidar biomass prediction models was investigated too. The results show that: 1) the prediction accuracy of models at footprint-level was acceptable at various plot-levels. The results were the best at at 1-ha scale; 2) the differences between biomass prediction models for disturbed and non-disturbed forests were statistically significant; and 3) the footprint-level models developed using 2009 data could be applied to 2003 data for forest biomass change estimation.
Accomplishments
1. Eco-3D campaign and Collection of validation data in field
The test site is located in Maine, USA, in a transition region between boreal and broadleaf biomes. The ~20×100 km study area includes the Northern Experimental Forest (NEF) near Howland, ME (45.25°N, 68.75°W), and the Penobscot Experimental Forest (PEF) near Bradley, ME (44.8°N, 68.6°W). An airborne-field campaign Eco-3D funded by NASA was conducted in summer 2011. Digital Beam forming Synthetic Aperture Radar (DBSAR) and Slope Imaging Multi-polarization Photon-counting Lidar (SIMPL) of NASA GSFC acquired data at test site and forest data were collected in field.
2. Biomass estimation from LVIS data
2.1. biomass estimation model
The biomass prediction based on the single independent variable regression models were generated. The RH50 and RH75 metrics perform similarly in terms of R2(0.88), RMSE (28.9 Mg/ha and 29.7 Mg/ha) and RRE.(28%).
The best multi-regression model from step-wise regression (both directions) selected RH25 and RH75 with multiple R2: 0.90, RSE: 26.94 Mg/ha, F-statistic: 491.1 on 2 and 106 degrees of freedom, and a p-value < 2.2e-16. The performances of single-independent and multi-independent models are very close. Therefore we simply choose the single-variable model for biomass estimation.
2.2. Effect of Disturbance on biomass estimation model
A statistical test was employed by adding a dummy variable (0 for disturbed and 1 for undisturbed forest) in the regression model. For the model using RH50, the coefficient for the dummy variable (6.2) is not equal to zero, so we reject the H0 hypothesis. Disturbance has a significant effect on the biomass prediction model. Hence, footprint-level single-variable models were developed for undisturbed and disturbed forest with RH50 models
2.3. Validation of prediction model in 2009
The footprint-level RH50 model from the combined data (Biom = 26.4 + 16.6*RH50) was first applied to 2009 LVIS data and then was validated at three plot-levels: 1) 0.25-ha plot (50m x 50m), 2) 0.5-ha plot (50m x 100m), and 3) 1-ha plot (50m x 200m), respectively. Similar steps were applied to the disturbance-specific RH50 models. The validation plots were divided into two groups of disturbed and undisturbed plots using LTSS VCT and air photos. Values of RMSE were 23.7 Mg/ha and 25.0 Mg/ha for undisturbed and disturbed models, respectively. Both are lower than the combined RH50 model (30.1 Mg/ha) at 1-ha plot-level.
2.4. Validation of prediction model in 2003
The biomass estimation model developed using 2009 data were applied to 2003 LVIS data. The results were tested using field measurements collected in October 2003. The predicted model has acceptable performance in 2003 (R2=0.62; RSME=39.2; RRE=27%).
2.5. Biomass mapping from LVIS data
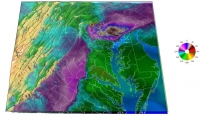
The above-ground biomass maps (Fig. 1) from LVIS data for year 2003 and 2009 were produced using the 1-ha RH50 regression model. The biomass was classified into 10 categories with an interval of 25 Mg/ha and a range to 275 Mg/ha.
2.6. Biomass change from 2003 to 2009
Fig. 2 shows the change of AGB from 2003 to 2009 at Howland (right) with corresponding reclassified disturbance map (left). It can be seen that the changes are consistent with the forest disturbance patterns detected from temporal LANDSAT images. Biomass changes in the old growth portion (highlighted by pink polygon in dotted line) were mostly positive (5 ~ 50 Mg/ha) or near neutral (-5 ~ 5 Mg/ha). The area surrounding the old growth forest showing strong negative change (-25 ~ -50 Mg/ha) degraded forests from logging that occurred during 2003-2009. These sheltwood cuts removed large trees accounting for about 1/3 of the basal area. Several patches in the middle of Howland forest show an increasing in biomass during 2003 to 2009, due to the forest regrowth after cuts in the 1990s.
3. SAR data processing
The repeat orbit interferometry package (ROI_PAC) developed by NASA JPL was modified to process the calibrated PALSAR single look complex data (Level 1.1). Coherence images at different seasons and at various environmental conditions were generated along with the temporal radar backscattering coefficients. The data will be further analyzed to evaluate its usefulness in target classification and parameters retrieval.
The coherence model upgraded from our former incoherent 3D radar backscatter model has been preliminary validated using SRTM and PALSAR data and will be further validated using UAVSAR PolInSAR data when it is available.
Refereed Journal Publications
Sun, G., K. Jon Ranson, Z. Guo, Z. Zhang, P. Montesano and D. Kimes, 2011, Forest Biomass Mapping From Lidar And Radar Synergies, Remote Sensing of Environment, vol. 115. Pp. 2906-2916. doi:10.1016/j.rse.2011.03.021.
Pang, Y., M. Lefsky, G. Sun, K. J. Ranson, 2011, Assessment of the impact of footprint diameter and off-nadir pointing on the accuracy of canopy height estimates from spaceborne lidar, Remote Sensing of Environment, vol. 115. doi:10.1016/j.rse.2010.08.025.
Other Publications and Conferences
Zhang, Z., Y. Wang, G. Sun, W. Ni, W. Huang, L. Zhang, 2011, Biomass Retrieval Based On Polarimetric Target Decomposition, Proceedings of IGARSS 2011, Vancouver, Canada, 24-29 July 2011.
Ni, W., Z. Guo, Z. Zhang, G. Sun, 2011, The Annual Behavior Of Backscattering And Coherence Of PALSAR Data, Proceedings of IGARSS 2011, Vancouver, Canada, 24-29 July 2011.
Huang, W., Sun, G., Dubayah, R., & Ni, W. (2011). Forest Biomass Estimation from Small and Medium Footprint Airborne LiDAR. In, 2011 AAG Annual Meeting. Seattle, Washington
Task Figures
| Fig. 1 – Change of above-ground biomass from 2003 and 2009 at 1-ha level by uniform and disturbance-specific RH50 models |


