")
Task 135
Improved Hypoxia Modeling for Nutrient Control Decisions in the Gulf of Mexico (Hypo-G)
Principal Investigator(s):
J. Stehr
Sponsor(s):
K. Pickering
Last Updated:
October 26, 2012 15:25:35
Description of Problem
Every year, a large dead zone in the Gulf of Mexico emerges, fed by large inputs of nitrogen and other nutrients from the Mississippi river. The dead zone consists of an area of low dissolved oxygen the size of Massachusetts arising from algae blooms and subsequent die off of the algae. Once the algae die, they decay, consuming oxygen and depriving other species of the oxygen they need to live. The dead zone leads directly to fish kills and loss of habitat for less mobile organisms such as mussels and crabs. The goal of the overall project is to provide a scientific basis for addressing the Gulf of Mexico dead zone. In particular, we will use NASA satellite products to evaluate predictions from rain and snow simulations and to provide ocean color evaluations. The University of Maryland (UMD) portion of this project seeks to approach one aspect of the nutrient loading to the Gulf, namely deposition of nutrients from the atmosphere in rain and snowfall. As nitrogen-rich water and snow fall on the watershed of the entire Mississippi River system, a portion of that nitrogen makes its way to the Gulf of Mexico, leading to the dead zone there. Some of the most important aspects of this problem are somewhat poorly understood and difficult to predict; precipitation and especially deposition of nutrients from precipitation are famously difficult to model. This project seeks to improve the understanding of these processes and to improve the ability of the models to treat these processes properly. It also responds to a plan put forward by the governors of Gulf of Mexico states, the Governors’ Action Plan for Healthy and Resilient Coasts.
Scientific Objectives and Approach
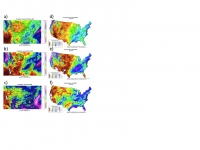
NASA, EPA and the University of Maryland, along with other partners, have teamed up to address this problem. In particular, our partners are the EPA Gulf of Mexico Program office and the Gulf of Mexico Modeling and Monitoring project at the EPA Office of Research and Development and colleagues at NASA. We are teaming up to use NASA satellite products to help evaluate the outputs of their air and water quality models. The UMD aspect of this collaboration involves comparing NASA and NOAA precipitation satellite and ground-based products to the precipitation part of the Gulf modeling system. This modeling system necessarily includes a meteorological model that drives the air and water quality models. In consultation with leading experts in the field, we have begun using 4 km resolution monthly Parameter-elevation Regressions on Independent Slopes Model (PRISM) data to compare with monthly aggregated WRF precipitation fields. The results are surprisingly good, which is promising, as our project relies heavily on getting reasonable values for wet deposition of nitrogen and other pollutants/nutrients. The PRISM model is a regression model that starts from the observational rain gauge data network, and performs an intelligent interpolation between monitoring stations to develop a better representation of precipitation. The dominant parameter is altitude, which is known to strongly affect precipitation, though other parameters are relevant as well.
Accomplishments
The meteorological modeling is complete, and the emissions and air quality modeling is nearing completion. In particular, the summer air quality modeling is already done, and the rest of the year has yet to finish. We have performed some qualitative evaluations of the meteorological model, as mentioned above, and found that the meteorological model performs admirably well in simulating precipitation on a monthly basis. Precipitation deposits nutrients directly to the watershed and washes them from the landscape into the rivers and streams that feed the Gulf. At the end of the day, it is the precipitation load that dictates the nutrient load to the Gulf from the air and the fertilized fields of the Gulf’s watershed. The WRF model is relatively new, so it is encouraging that its performance is good. See below in #7 for a figure.
5 & 6. No publications or conference presentations as yet, at least by me.


