")
Task 106
Investigations of Saharan Air Layer Dust Distributions and their Influence on the African Easterly Jet and African Monsoon Hydrological Cycle
Principal Investigator(s):
Z. Li
Sponsor(s):
Peter Colarco
Last Updated:
October 26, 2012 15:25:21
Description of Problem
The objective of our project is to use the NASA Goddard Earth Observing System version 5 (GEOS-4 and GEOS-5, respectively) atmospheric general circulation model (AGCM) and data assimilation system to understand the influence of the parameterization of dust emission on simulated dust distributions, particular, the effects of varying the source scheme, model resolution, and meteorology on emission and aerosol optical thickness (AOT) distributions. We employed several satellite and in situ observation datasets to understand the controls on an observed barrier to dust transport over the Caribbean.
Scientific Objectives and Approach
-Improve the parameterization of the dust emission process in the NASA GEOS-4/5 AGCM through the use of the Mineral Dust Entrainment and Deposition (DEAD) dust emission scheme and sub-grid wind variability.
-Validate GEOS-5 vertical dust distributions by determining settling rates and optical properties using CALIOP extinction profiles.
-Investigate the effect of model resolution on dust sources and distributions.
-Use GEOS-5 to understand the controls on the observed Central American dust barrier.
Accomplishments
To summarize the past efforts: The aerosol module in GEOS-4/5 is based on a version of the Goddard Chemistry, Aerosol, Radiation, and Transport (GOCART) model. We analyzed the effect of replacing the GOCART dust emission scheme based on Ginoux et al. [2001] with a more physically based scheme that is a version of the Dust Entrainment and Deposition (DEAD) model [Zender et al., 2003] and evaluated it during NASA African Monsoon Multidisciplinary Analyses (NAMMA) field experiment (August – September, 2006). Additionally, we have evaluated GEOS-5 simulated vertical distributions using observations from CALIOP. Then, we used GEOS-5 to understand the cause and controls on the observed Central American dust barrier during the NASA TC4 field campaign (July – August 2007). This work is complete and will be submitted to JGR-Atmospheres shortly.
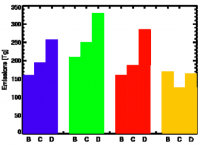
Currently, we are working on understanding the role of model resolution, source scheme, and meteorology on simulated dust distributions by performing several sensitivity tests for April 2008. In the sensitivity tests, a high-resolution dust source function (0.25°x0.25°) was used in a set of simulations run with the standard GOCART mobilization scheme, the DEAD mobilization scheme, and the GOCART mobilization scheme with the 10-meter wind speed replaced by the equivalent neutral 10-meter wind speed (GOCART-10N). The equivalent neutral 10-meter wind speed has a dependency on the surface wind stress, and provides a link to the surface in the GOCART scheme. A fourth sensitivity test was aimed at understanding the effect of source function resolution was performed using the standard GOCART mobilization scheme with a coarser (2°x2.5°) source function (GOCART-B). To understand how the simulated dust distributions vary with spatial resolution, the sensitivity tests were performed at 2°x2.5° (“B”), 1°x1.25° (“C”), and 0.5°x0.625° (“D”) resolution. Figure 1 shows the April 2008 African dust emissions and AOT for our sensitivity tests as a function of spatial resolution. For simulations using versions of the GOCART emission scheme, dust emissions increase with resolution. The GOCART and GOCART-10N simulations increase linearly with model resolution, while GOCART-B has a nonlinear dependence. The DEAD simulation exhibits a unique dependence on resolution over Africa. Emissions decrease from “B” to “C” resolution and then increase from “C” to “D” resolution. DEAD scheme emissions are more sensitive to soil moisture. Our “C” resolution simulation produces more precipitation than at “B” resolution and inhibits dust emission. However, at “D” resolution, we suspect that this effect is somewhat countered by the higher resolution of the driving winds.
Task Figures
| Fig. 1 – |
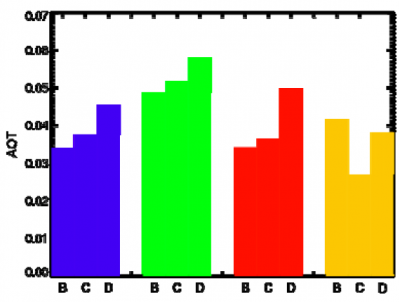 Fig. 2 – |


