")
D.C. Storms Kick Off Lightning Safety Awareness Week
By: Scott Rudlosky
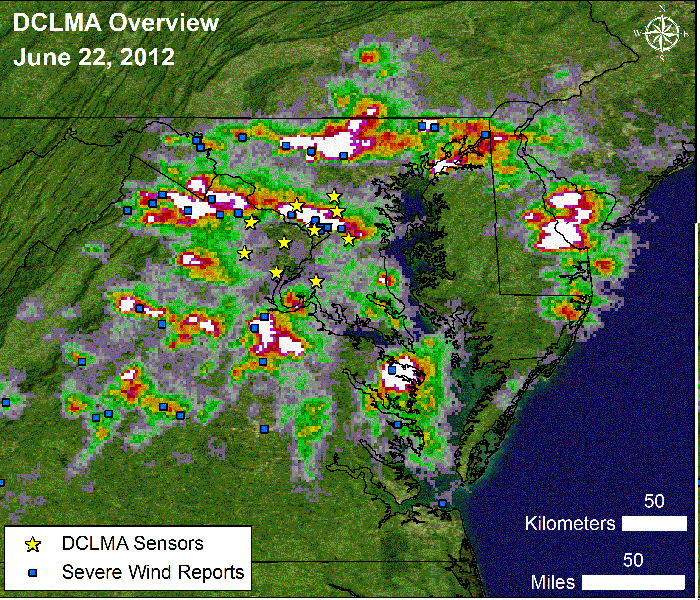
The Washington D.C. Lightning Mapping Array (DCLMA) consists of 10 sensors that monitor very high frequency radio waves emitted by lightning. The DCLMA has been operational since 2007, providing detailed 3-D lightning observations that help inform decision makers regarding severe weather and lightning threats. The DCLMA clearly depicts the areal coverage of lightning in real time, and recent studies indicate that increasing lightning flash rates often precede severe winds, hail, and tornados. Thus, expanding the visibility and use of this valuable public resource will lead to improved safety for residents and visitors of the Washington Metropolitan Area.
On Friday June 22, 2012, severe weather in the D.C. region demonstrated the destructive power of convective storms, revealed the value of the DCLMA, and provided a fitting introduction to NOAA’s Lightning Safety Awareness Week (June 24-30). The image to the left illustrates Friday’s DCLMA observations alongside confirmed severe wind reports. Between 7:30 and 8:00 pm, a severe storm passed directly through the center of the network, producing a trail of damage from Potomac, MD through northern D.C., and ending near Bladensburg, MD where a microburst (winds estimated at 90-100 mph) ripped the roof off an apartment building. The Baltimore/Washington National Weather Service (NWS) provides a thorough discussion of Friday’s severe weather event at the following link (http://www.erh.noaa.gov/lwx/events/svrwx_20120622/).
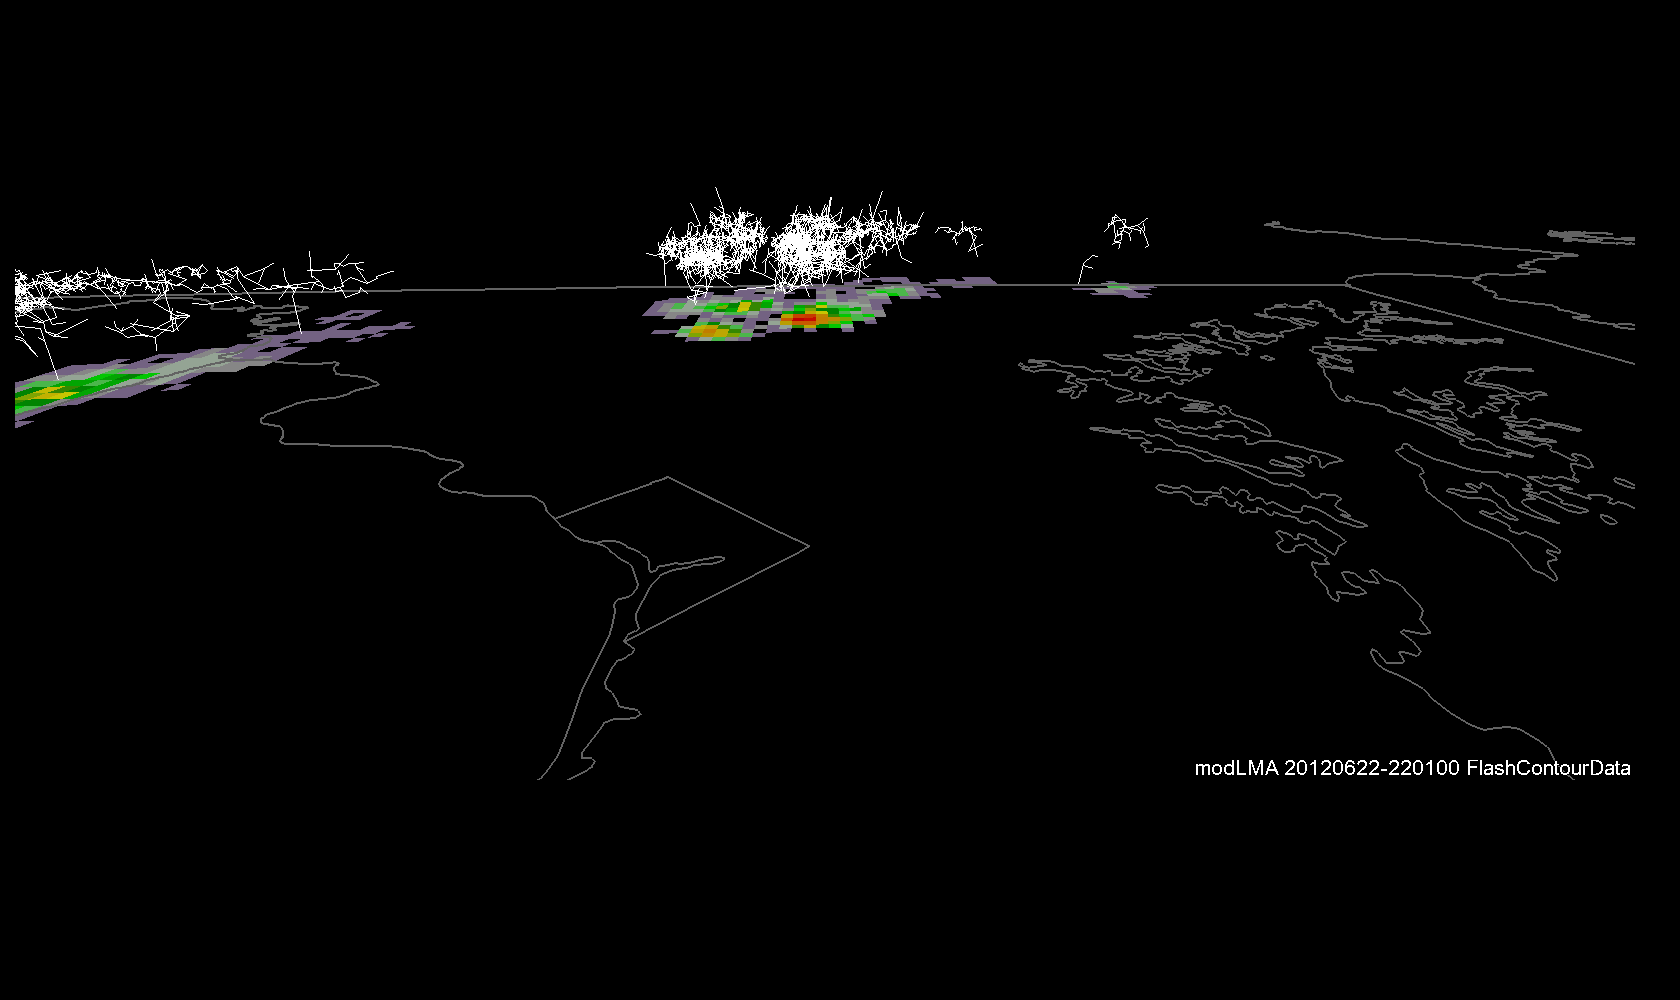 (Click image for animation) – Cross-section view of lightning channels every minute with severe wind reports (blue arrows) overlaid (6:00–9:00 pm). Generally, greater flash rates (warmer colors on the plan view) indicate more intense storms.
NWS forecasters monitored the DCLMA information as part of Friday’s severe weather warning operations, but the value of this information is not limited to government forecasters. The animation above demonstrates the remarkable observational capabilities of the DCLMA, providing a unique perspective of the storm’s spatial and temporal variability. The relative number of lightning flashes (white channels) in each one minute frame illustrates variability in storm intensity. Since people generally are aware of the lightning threat during storms of this strength, most lightning casualties occur when the threat is less obvious, often during the beginning and end of storms or at locations distant from the most intense lightning activity.
 (Click image for animation) – Plan view of lightning channels every minute, showing the great distances that lightning can propagate from its parent storm (6:44–8:54 pm). Note that the distance between the top and bottom of this image is approximately 75 miles.
Focused lightning safety efforts have helped reduce lightning casualties in recent years, and NOAA’s Lightning Safety Awareness Week seeks to build upon this recent success (http://www.lightningsafety.noaa.gov/). Lightning channels often extend great distances from the parent storm, in some cases more than 50 miles (see animation above). These flashes typically are obscured from view by clouds, and can strike ground at any point along their path, illustrating why caution must be taken any time lightning is in the area, hence “When thunder roars, go indoors”.
Insights gained using DCLMA information also will be applied following launch of the next generation geostationary satellite series (GOES-R). The DCLMA is a research system providing real-time data to NWS forecasters as part of GOES-R Proving Ground efforts to advance user readiness. GOES-R will house a Geostationary Lightning Mapper (GLM) that will provide a public source of real-time lightning information throughout the United States and adjacent oceans for the first time. Meanwhile, the DCLMA will continue to promote public safety and provide scientists with valuable lightning observations.
Project Sponsors
DCLMA sponsors include the National Aeronautics and Space Administration (NASA), National Oceanic and Atmospheric Administration (NOAA), National Environmental Satellite, Data, and Information Service (NESDIS), GOES-R Program Office, University of Alabama Huntsville (UAH), University of Maryland (UMD), New Mexico Institute of Mining and Technology, and our site hosts (Howard University, Northern Virginia Community College, George Mason University, Johns Hopkins University Applied Physics Laboratory, College of Southern Maryland, UMD Agricultural Institute, Montgomery College, and the NWS Sterling Field Support Center). Individuals directly responsible for DCLMA operations include Steve Goodman (NOAA), Rich Blakeslee (NASA), Jeff Bailey (UAH), John Hall (UAH), Scott Rudlosky (NOAA), and Dustin Shea (UMD). The animations were created using the Warning Decision Support System – Integrated Information (WDSS-II) software (developed and maintained by the University of Oklahoma and the National Severe Storms Laboratory).
Related Links
NWS Baltimore/Washington June 22, 2012 Analysis
Washington Post – Bladensburg Storm Damage Photos