")
If you’ve ever been to an ESSIC Maryland Day exhibit, you may have seen the illuminated globe with weather and climate images moving across its surface. But it’s no ordinary globe. In fact, it’s called the Magic Planet, and it is essentially a smaller, more portable version of NOAA’s Science on a Sphere.
NOAA developed Science on a Sphere as an educational tool, creating “a room sized, global display system that uses computers and video projectors to display planetary data onto a six foot diameter sphere, analogous to a giant animated globe,” according to the program’s website.
Though created by a separate company, the Magic Planet serves the same purpose as the Science on a Sphere, and both can demonstrate a wide variety of earth systems, like climate change or severe weather patterns.
While NOAA invented and uses the Science on a Sphere, NASA uses both the spheres and the smaller Magic Planets. These animated globes are in museums, institutions and schools nationwide, and presenters use the images displayed to educate visitors of all ages, school groups or other expert audiences about earth systems and how they relate to the environment.
The University of Maryland is connected to both Science on a Sphere and the Magic Planet.
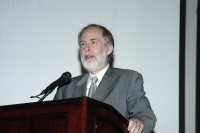
ESSIC Deputy Director Phil Arkin has a grant from the NOAA Office of Education that he uses to help develop data for spherical displays of all types. The project is involved with at least four other institutions, including the University of Wisconsin, and focuses on the outreach aspect of the different spheres.
“One of the obvious things that people like to do is display maps of the world and data projects that can be mapped on the world, like satellite imagery, sea surface temperatures, that sort of thing,” Arkin said. “Our role here is to help create climate data sets and provide information for the people who are displaying those sets.”
Often, said Arkin, the spheres are being presented by museums’ or other institutions’ staff who may not actually be experts on the data that comes with the sphere. Arkin’s project works to develop scripts for the presenters that can help them accurately interpret the images projected on the sphere.
The data that is used on the Science on a Sphere is collected by NASA and NOAA. Then, those working as a part of Arkin’s grant determine which data sets would actually work in a visual presentation.
“We’re trying to solve the interface problem, and it’s challenging because the tools we normally use are for people who are in the field and can understand it, but it’s not understandable for the general public,” he said. “We have to come up with an intermediate display that can be more intuitive.”
For example, one of the Magic Planets is located at the National Zoo, where visitors can spot herds of elephants and school children alike. Explaining climate phenomena and anomalies to a third grader can be hard, so presenters will pick their programs depending on what the audience is interested in, and it’s not always climate related.
“When you think about it, a map of climate is not an easy thing to define,” said Arkin. “Climate is hard to define and a map of climate can be even harder.”
A recent report on the uses of Science on a Sphere models in 62 different locations concluded that the most popular presentation topics were astronomy, satellite weather and the recent Japanese earthquake and tsunami , but other popular presentation topics included things like animal migration and marine life.
At the University of Maryland, a Magic Planet is often displayed at ESSIC’s Maryland Day exhibit, with climate presentations that visitors can understand, like the popular display on El Niño and El Niña used at past exhibits.
Since 2009, ESSIC had been borrowing the Magic Planet for Maryland Day displays until recently when the NOAA office in Silver Spring gave it to the university for good, said ESSIC Assistant Director Andy Negri.
Along with the actual “planet,” manufactured by the California company, Global Imagination, ESSIC received an interface from NASA called “Science Explorer” that determines what is displayed and then explains to the viewer what they are seeing.
This is a key aspect of the planet, said Negri, because then viewers can actually understand what is happening during the globe’s presentation.
“The new interface from NASA is terrific because someone has written something about each data set, the instrument that it came from and the satellite on which the instrument is located,” said Negri.
The interface comes with a touch screen kiosk as well where viewers can read these descriptions. This is an important aspect for engaging viewers during Maryland Day or at other events, such as career fairs, American Meteorological Society meetings, climate conferences or some of the other places where the Magic Planet has traveled.
While the Magic Planet often does a great job captivating viewers and promoting ESSIC, Arkin hopes to keep broadening the use of all spherical models to include more complex climate events that are harder to display and explain to the public.
“I’m hopeful that the sphere will make it easier for us to come up with visuals and associated words that will be better than the flat displays we’ve had in the past. The spherical displays allow us to show how things relate to each other on the surface of the earth,” said Arkin.
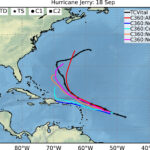
A spherical projection is the only way to display many things in their proper geometric form, said Arkin, like the jet flow stream around the earth or the just how close Canada is to Siberia.
Creating a spherical projection system like the one inside the Magic Planet is no easy task, said ESSIC IT Administrator Mike Maddox, who worked to develop and upgrade the technical aspects of ESSIC’s Magic Planet.
The smaller Magic Planets actually have a projector inside of them, and the larger Science on a Sphere models have three external projectors to display images on the surface of the globe.
The format for data input is actually generic enough that any scientist could take their data and map it in to a display, said Negri, but getting the projection just right is the difficult part. Instead, ESSIC relies on data sets from NOAA and NASA for their displays, often with great success.
Still, Arkin hopes that he and researchers working under his grant will be able to create more climate-specific displays that anyone could follow, many of which would have to display changes over a period of time.
“What we would normally do is show a succession of pictures showing a month at a time and going all the way through a year,” said Arkin. “This is conventional and has already been done, but with a sphere we could amplify that demonstration.”
Read more information on Science on a Sphere here and Magic Planet here.


